CCP has released the monthly economic report for June 2018, and it might turn out to be an interesting report for comparison sake. June was a month of dull peace in Delve, with ratting and mining and production and commerce rolling along unhindered.
But now, in July, we have conflicts in null sec. Pandemic Legion has deployed to the southeast to join in on the attacks on TEST and the Legacy Coalition while the Imperium has taken PLs absence from the north as an opportunity to roll north, drop a Keepstar, and start pounding on Circle of Two and Guardians of the Galaxy. That not only pulled a bunch of capsuleers north, but also the super capital umbrella that protects Delve as well, leaving those who didn’t get the word (which always happens), or thought they were invulnerable, open to attack.
So we can look at the June numbers as a baseline for how war changes output in Delve. And we can start, as usual, with the mining numbers.
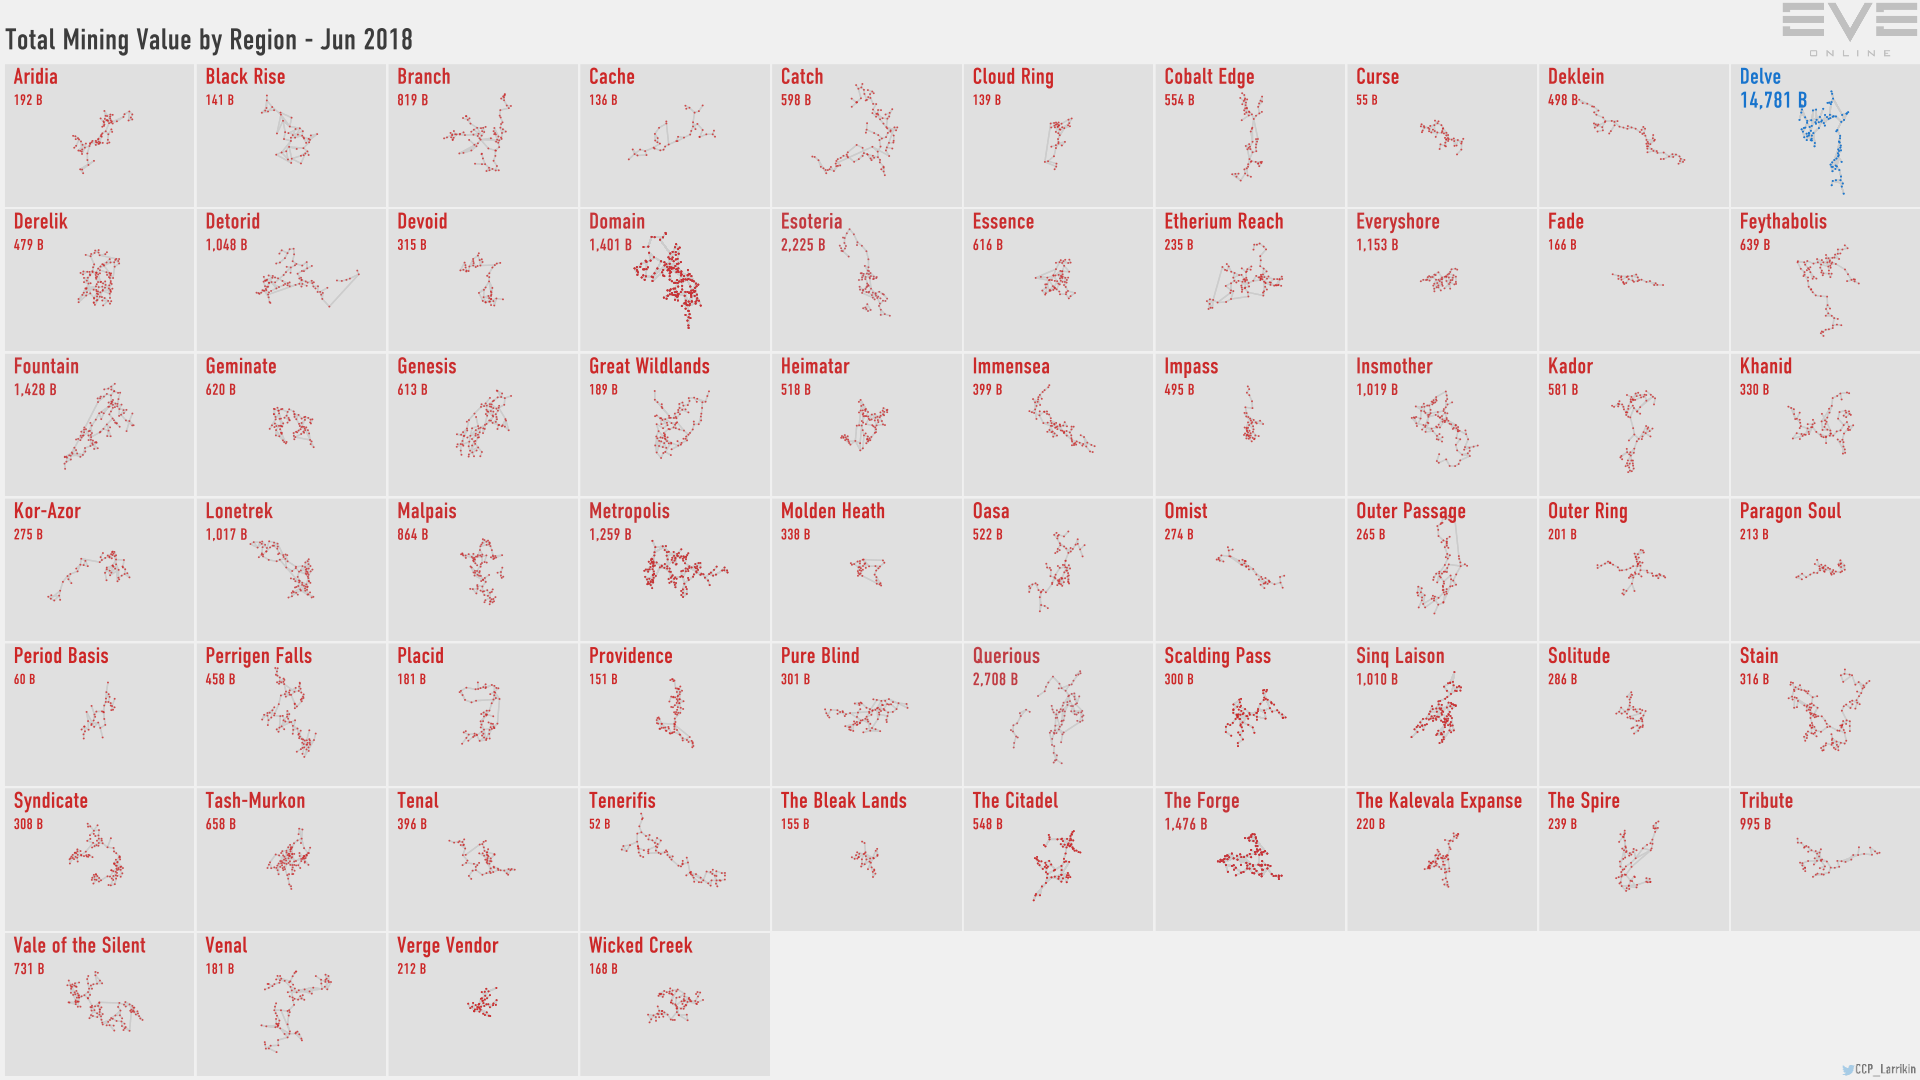
June 2018 – Mining Value by Region
We even have the bar graph back this month.
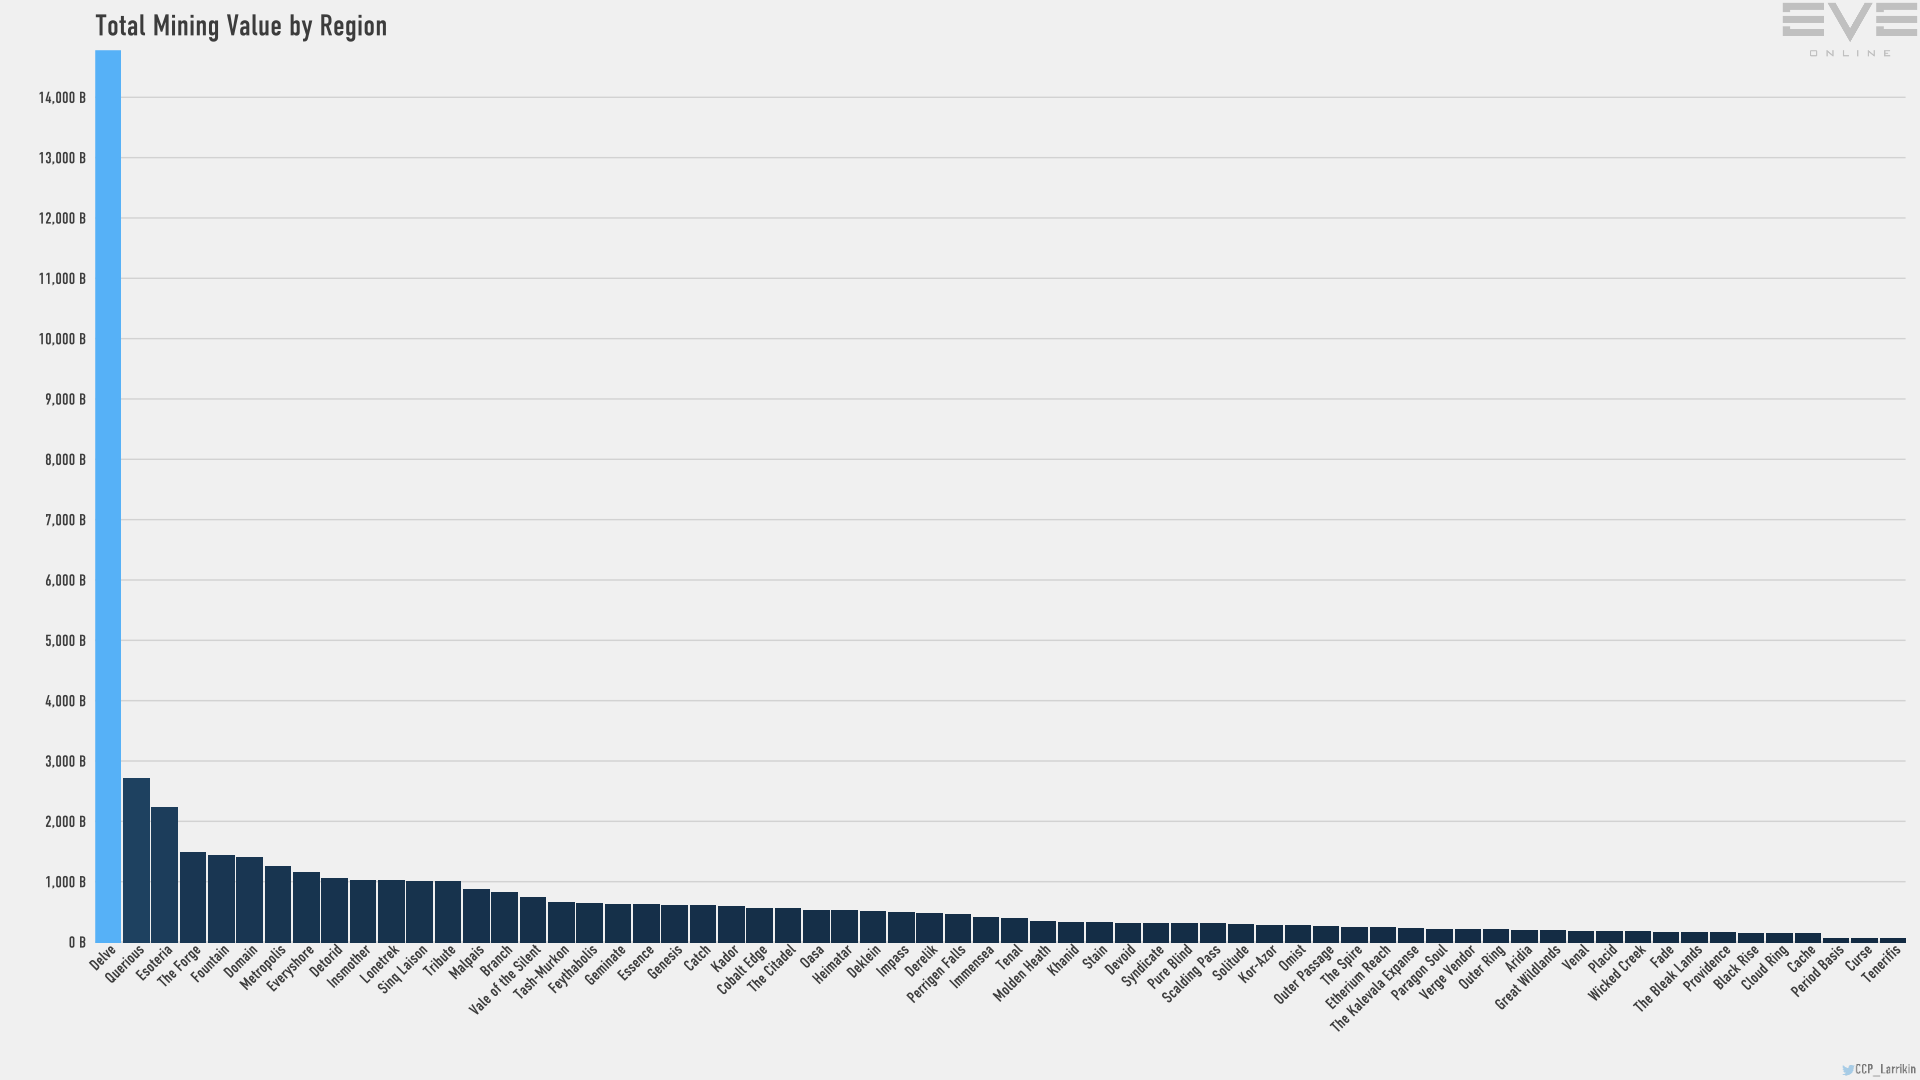
June 2018 – Mining Value by Region – Bar Graph
Delve is, as usual, far ahead of every other region in mining output, and second place is Querious, which is also controlled by the Imperium and the host to the monthly “locust fleet” operations to harvest moon output in the region. The scourge of the Rorquals I suppose.
Delve was up 600 billion over May, which is fairly impressive because the mining value measurement depends on the price, and prices were again down in June.
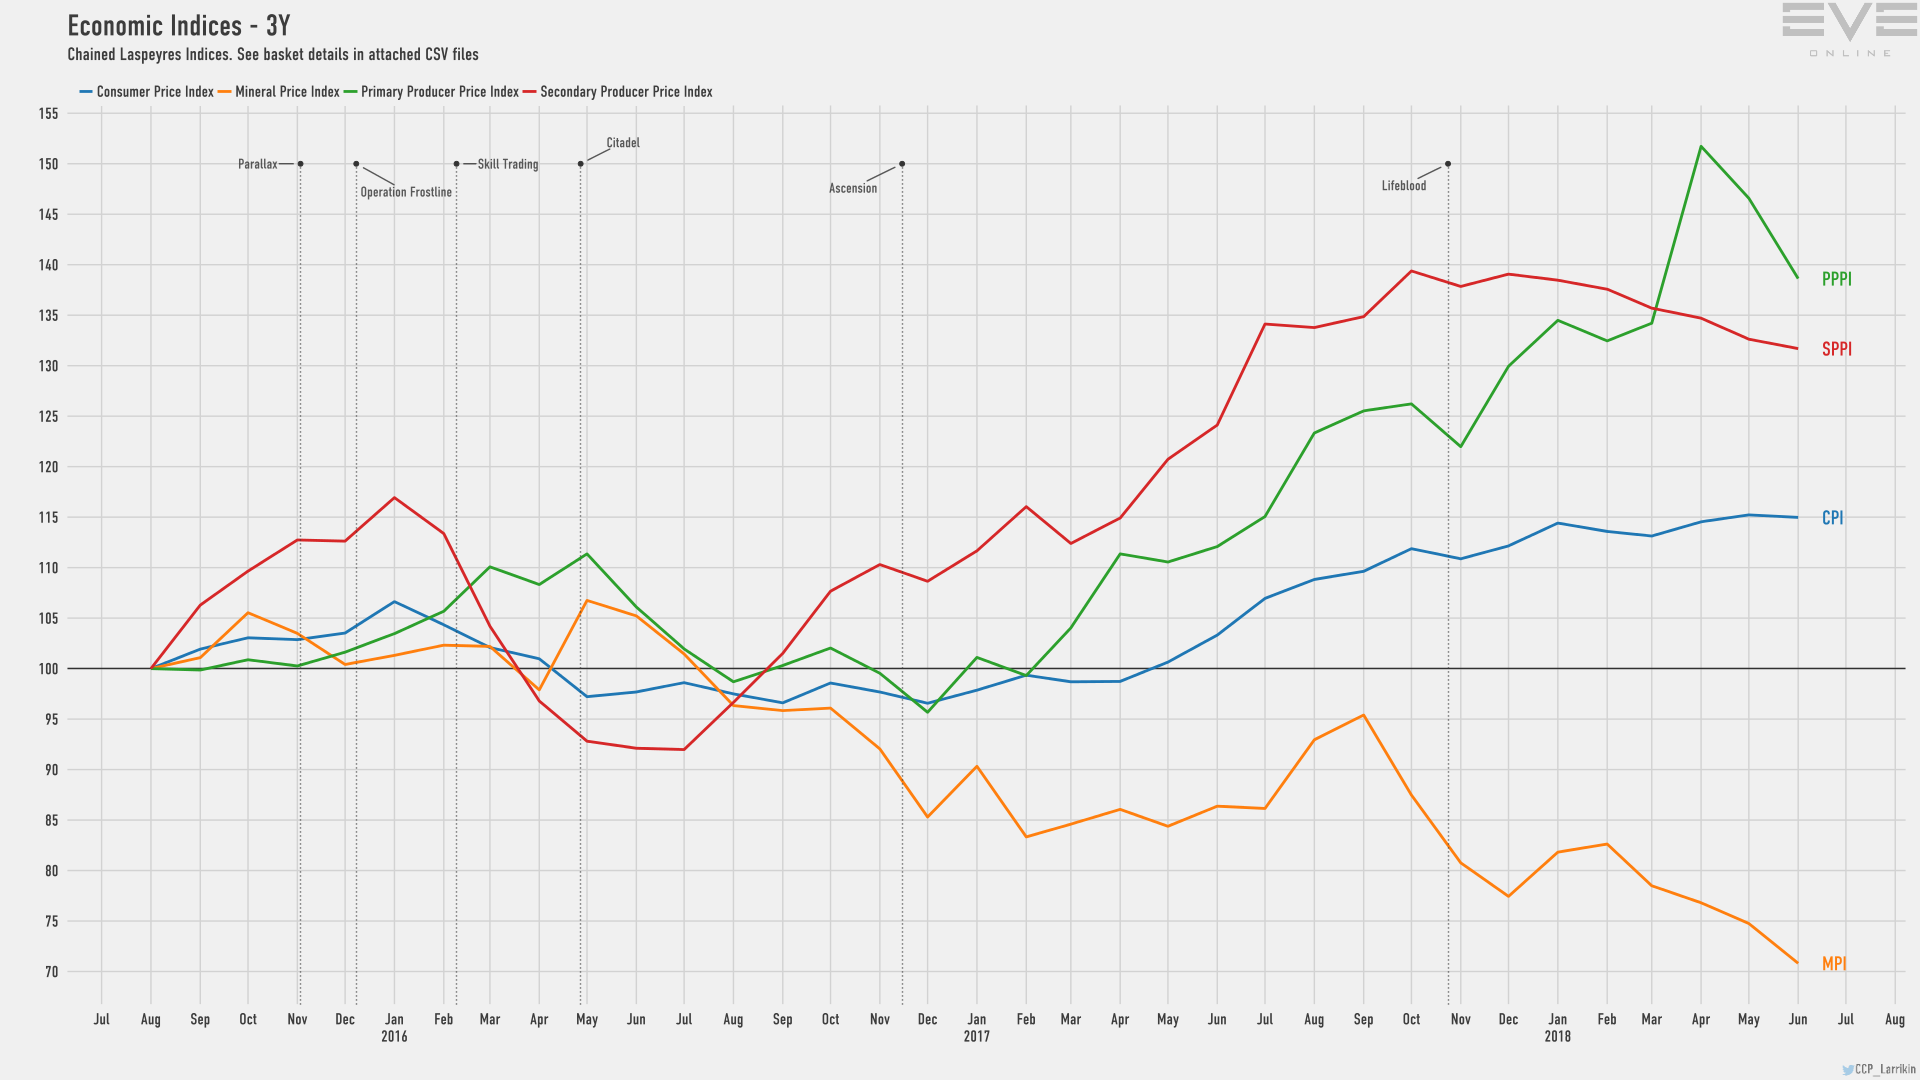
June 2018 – Economic Indices – Three Year Snapshot
If the price of minerals is still headed down but mining value in Delve is up, that means a lot more ore had to get mined.
Mineral prices aren’t close to their all time low yet, as the long term chart shows.
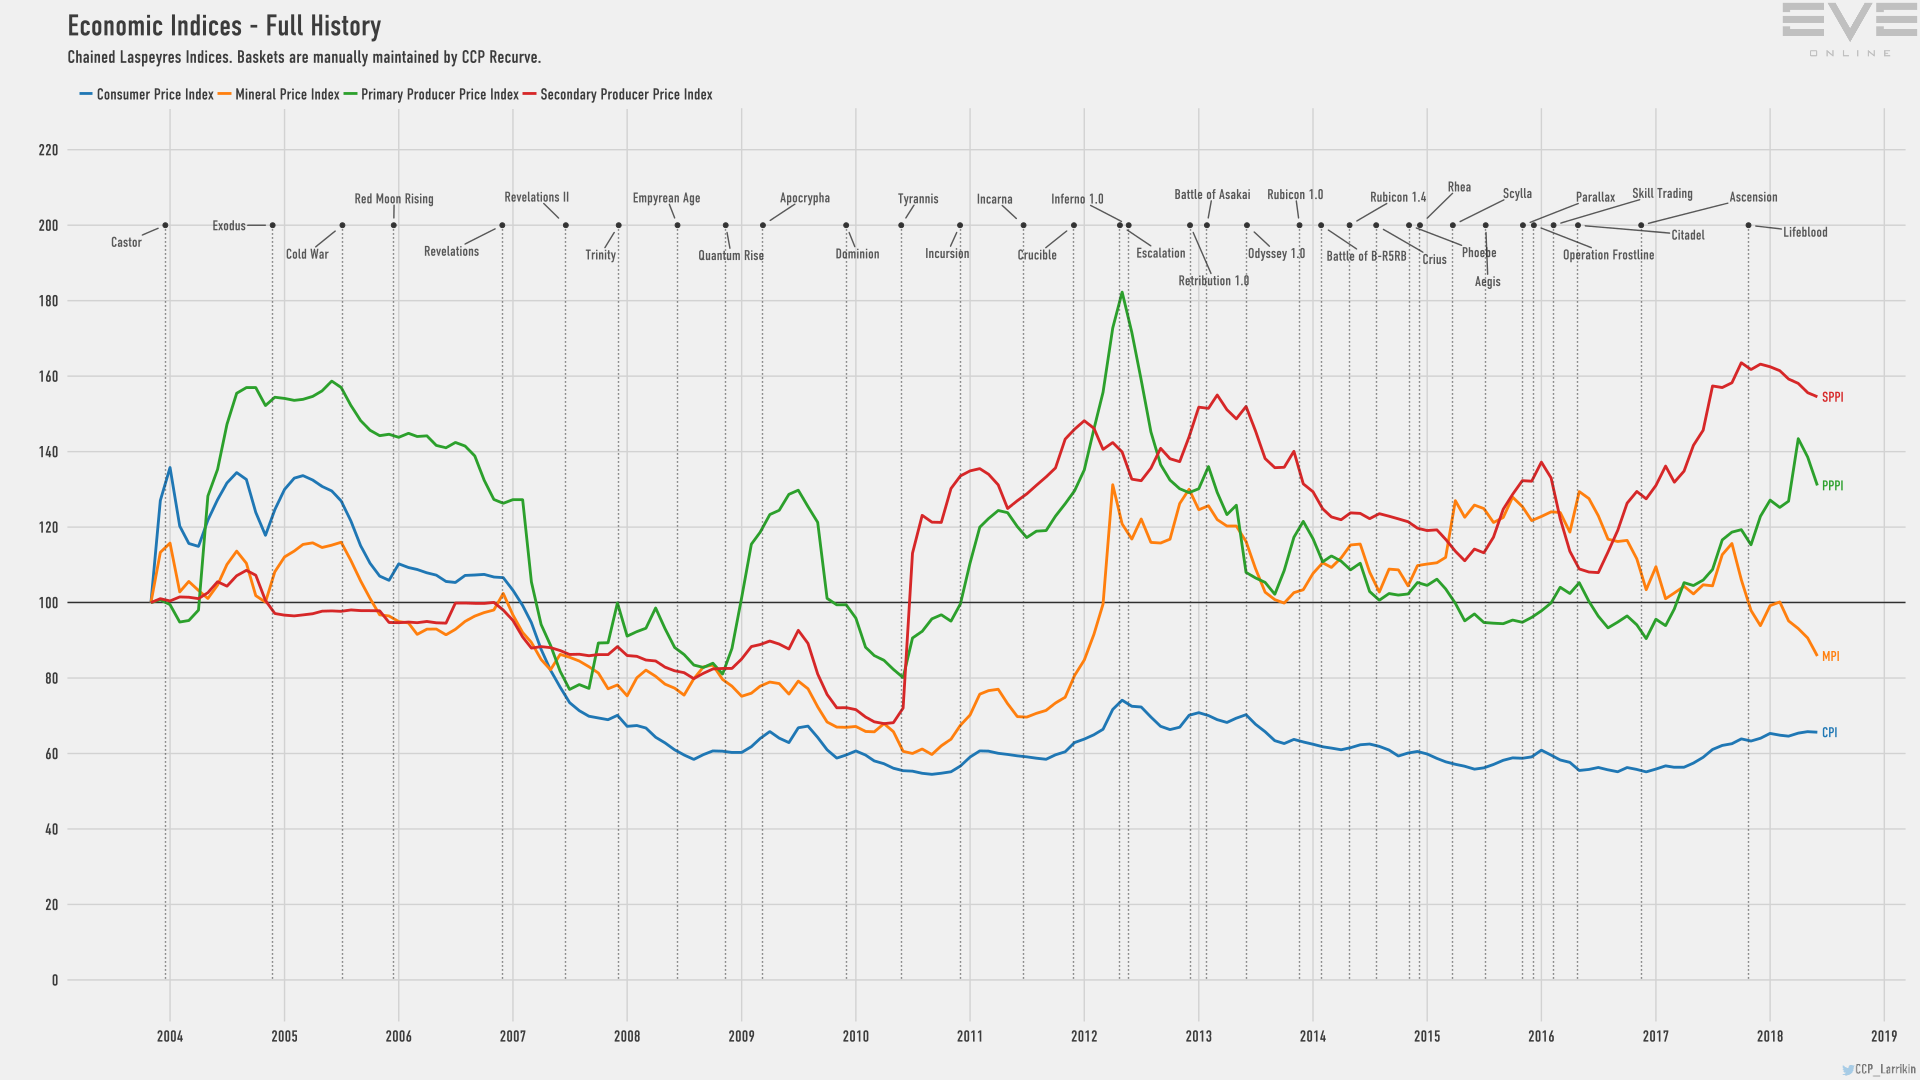
June 2018 – Economic Indices Long Term
But the trend is still way down. Cheaper prices make it harder to get rich as a miner… unless you’re running a fleet of Rorquals… but they also make manufactured items cheaper overall in Jita. If you’re not a miner, this is probably good. If you are, it probably pisses you off.
On the NPC bounties front, Delve also held on to its top spot.
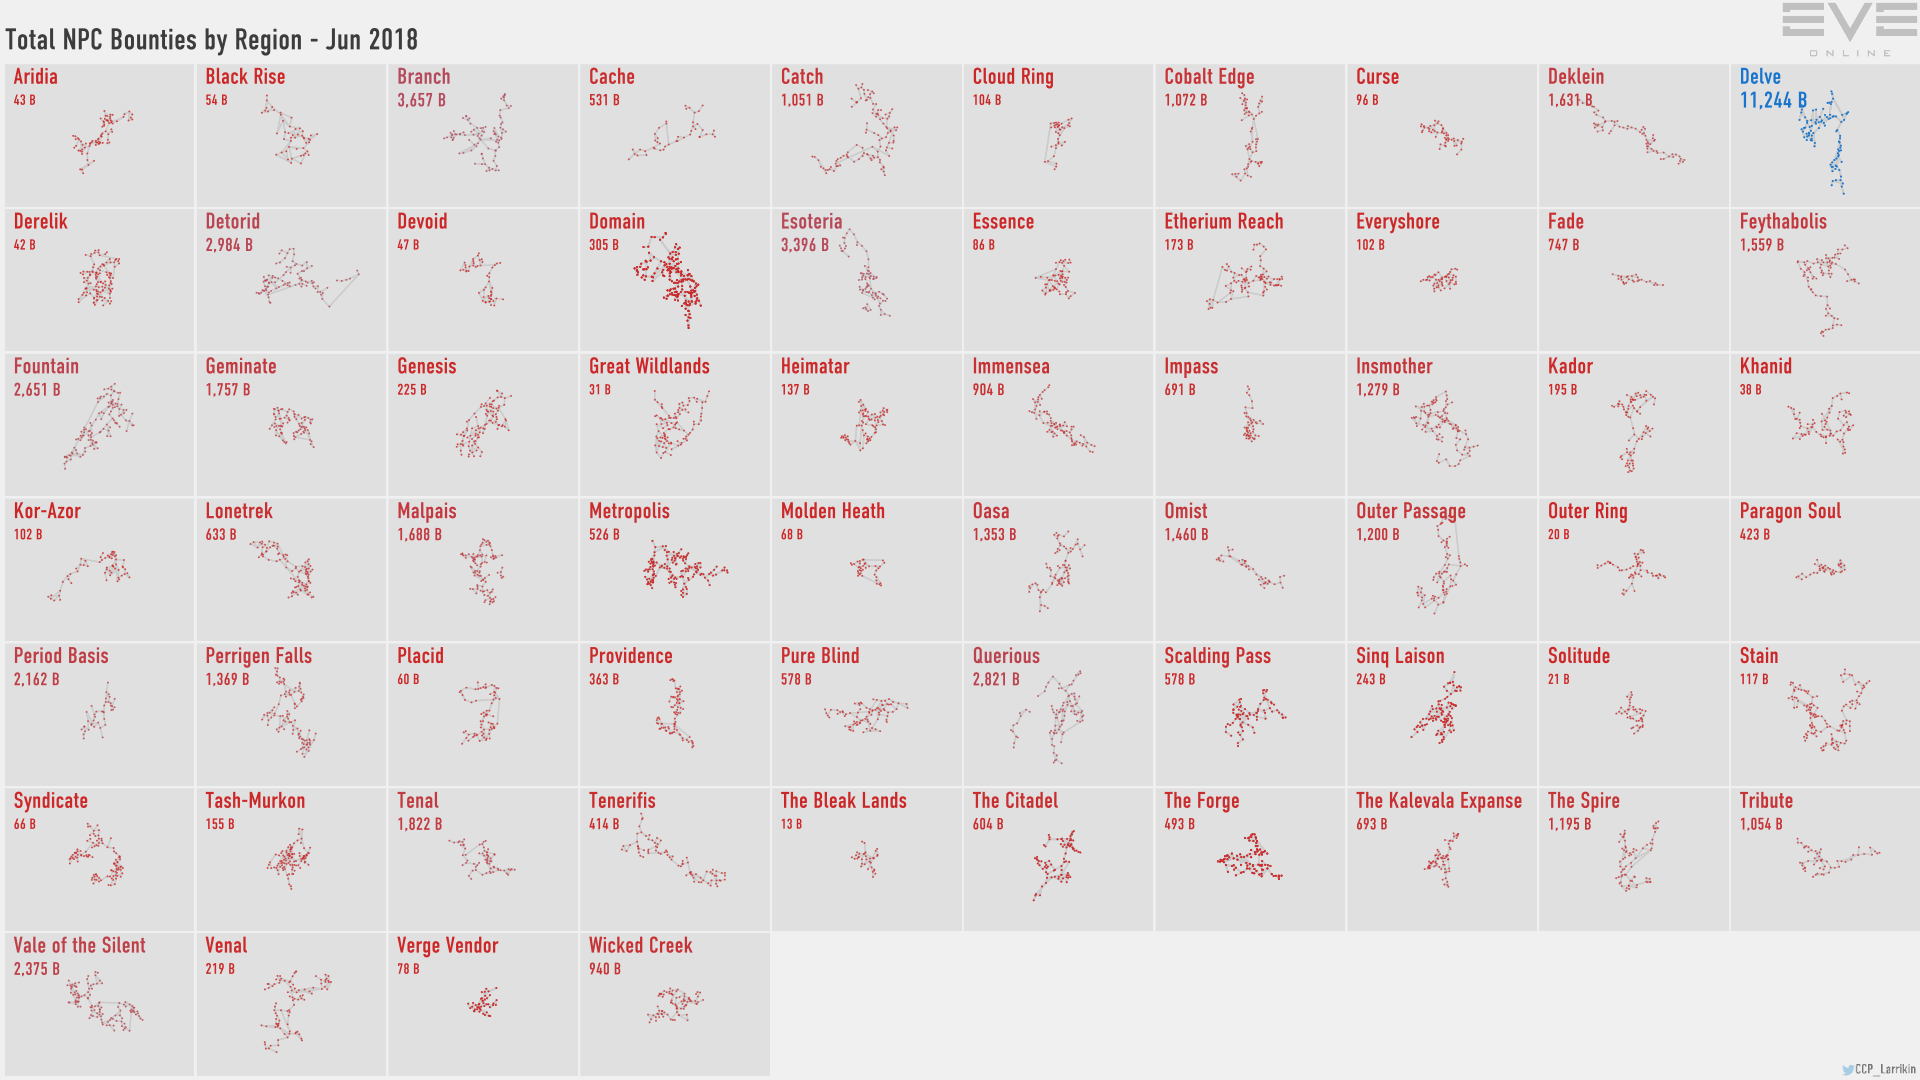
June 2018 – NPC Bounties by Region
Again, we have the bar graph back. Several of those went missing for the May report.

June 2018 – NPC Bounties by Region – Bar Graph
Delve, despite its dominance, was down almost 2 trillion ISK compared to May. Meanwhile Branch was up, the place where the groups in the north have fled to escape the attentions of the Imperium SIGs and Squads.
Fade was up, almost doubling from May’s 396 billion ISK number by hitting 747 billion ISK. That is no doubt due to Circle of Two moving in and settling down in the region and having the first half of the month free of attacks as the Imperium took two weeks off in June to give its pilots a break. I suspect that number will be down in the July report due to the return of the Imperium. Rumor has it that GigX has forbidden anybody to rat in anything more expensive than a VNI or mine in anything better than a T1 barge.
The share of bounties across sec status remains heavily tilted towards null sec.

June 2018 – NPC Bounties by Sec Status
High sec, which was trending up a bit over the last couple of reports, was back down to 6.2% of the total, while overall bounty payments saw a slight decline over the course of the month.

June 2018 – Top 8 ISK Sinks and Faucets
On the trade front The Forge was in no danger of losing its top position. Jita remains the place to go to buy and sell.

June 2018 – Trade Value by Region
The bar graph shows the dominance of Jita more clearly.

June 2018 – Trade Value by Region – Bar Graph
That dominance is such that they have to make a bar graph without The Forge in order for people to see how other regions stack up against each other.

June 2018 – Trade Value by Region – Bar Graph, Forge Excluded
There we see Domain, home of Amarr, still comfortably in second place, with Delve trailing behind in third. After that are the three other New Eden high sec trade hubs, then Geminate, home of Pandemic Horde.
For contracts however The Forge is not as dominant.

June 2018 – Contracts Trade Value by Region – Bar Chart
There are a lot of contracts in Jita, but Delve is not far behind. As usual, I suspect this is because a lot of things like fleet doctrine ship sales, capital and super capital sales, buy back schemes, and some raw material sales are done via contract. Still, overall, contracts remain a small item in Jita relative to the main market.
Then there is production.

June 2018 – Production Values by Region
Previously Delve was the top region for production, though the three regions in the vicinity of Jita still combined to well out produce Delve. However this month Delve slipped, dropping from 40 trillion ISK in production in May to 33 trillion ISK in June, putting it in close competition with The Forge, which held steady with 32 trillion ISK.
What happened in Delve? Did we run out of pilots rich enough to buy a titan finally? Is that why The Mittani was was extolling us to get alts into supers if we already had a main in one?
Anyway, production was down. We will see if a war suppresses it further or if losses… should we join battle in any serious way… will spur production in order to replace them.
And so this month’s chart of interest is the destroyed value by region.

June 2018 – Destroyed Value by Region
War in New Eden may make this chart interesting to compare with next month’s chart. But I also wanted to compare it against May’s chart to see what Into the Abyss did to the numbers. I was wondering if the losses in abyssal pockets would up the numbers. But abyssal pockets aren’t in normal space, so in places like The Forge, ever a hot spot for suicide ganking, destruction numbers actually went down 800 billion ISK.
So Into the Abyss didn’t change the chart, but I suspect war might. So we will revisit this one again next month.
Finally, I will close with the usual regional comparison chart.

June 2018 – Regional Stats
That just nicely summarizes the stats for a few key regions.
Those were the June numbers. But now, in July, war is on, both in the northeast around Fade, where the Imperium is pressing on CO2 and GotG, and in the southwest, where Pandemic Legion is leading a large but loose coalition of alliances against the TEST and the Legacy Coalition. If both conflicts carry on, the numbers could change up quite a bit. But wars can also end suddenly. We shall see.
Again, you can find the monthly economic report here. It includes many more charts than I choose to review and has all the raw data if you care to make your own.
No comments:
Post a Comment