The EVE Online monthly economic report for February came out on Friday, so it is time to see one again what is up in the New Eden economy.
As the title suggests, the first thing I want to look at is mining, which went up quite a bit in Delve during February.
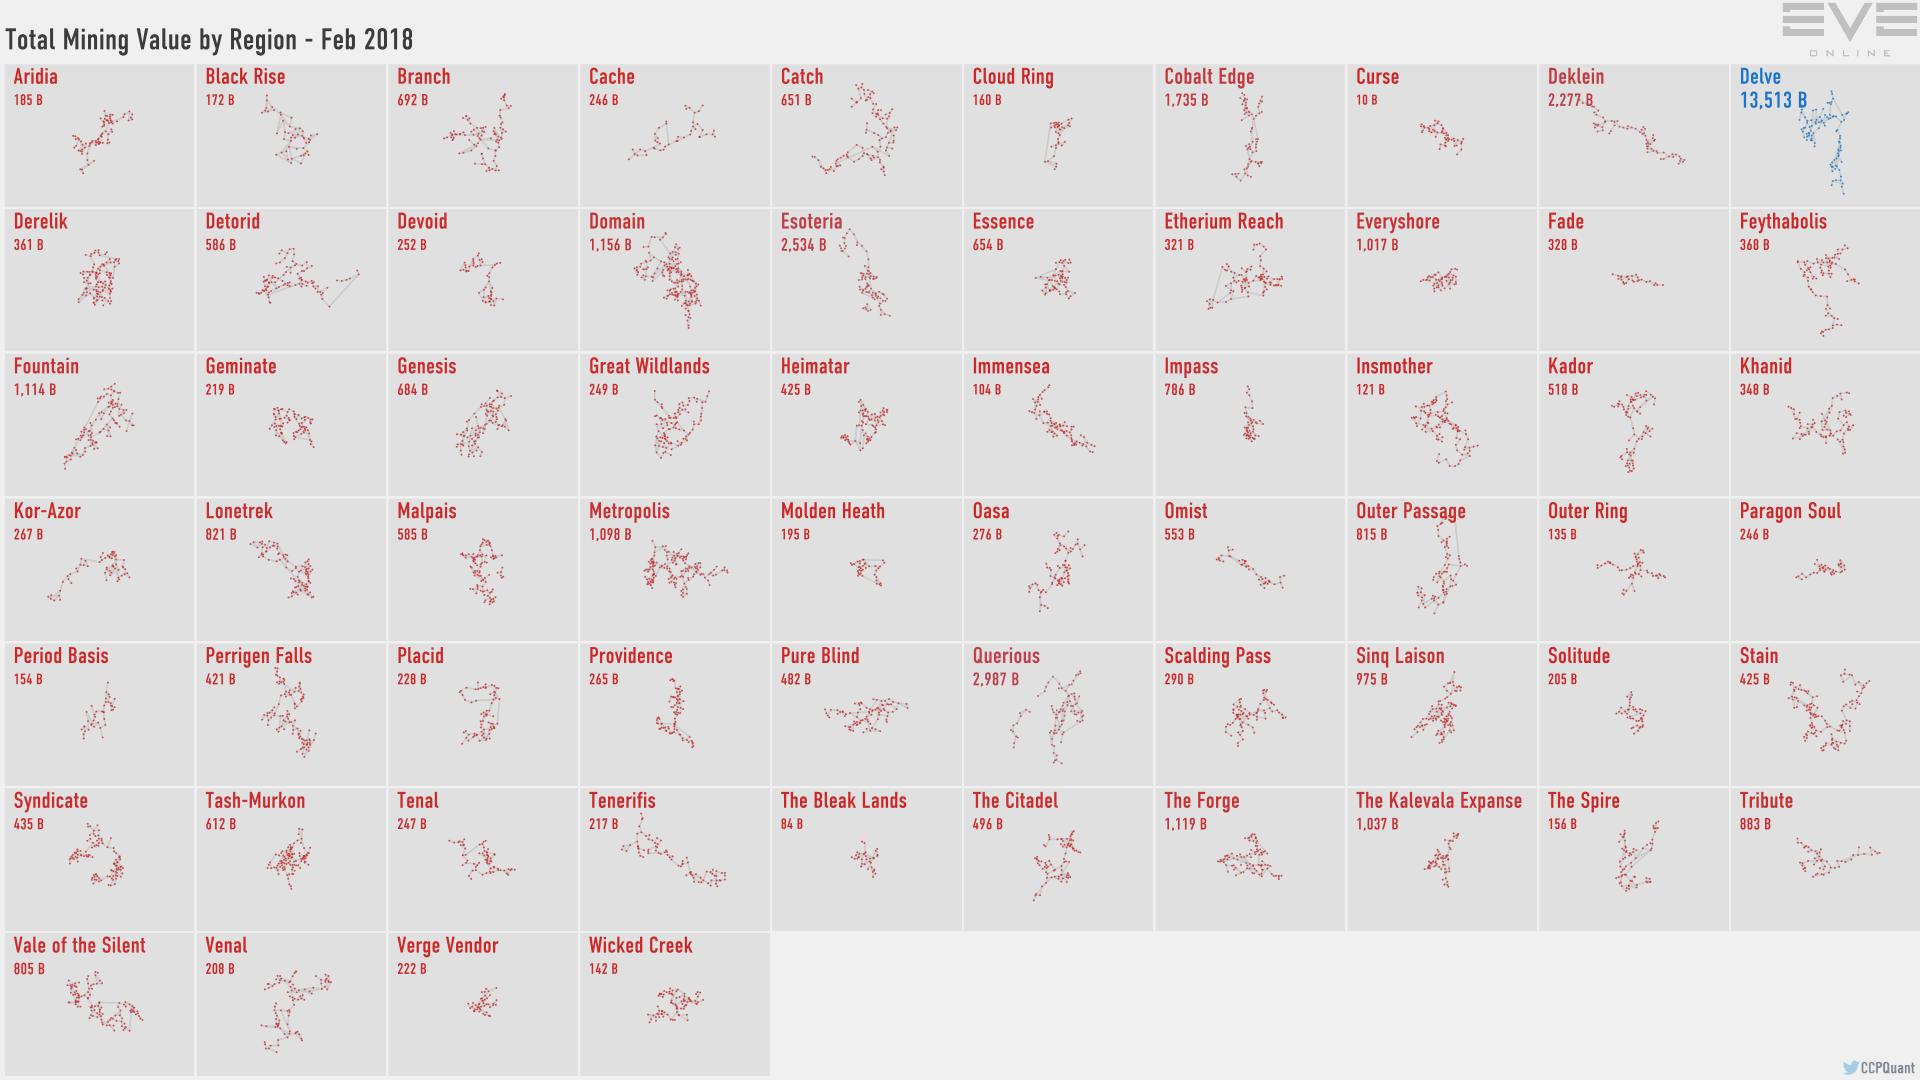
February 2018 – Mining Value by Region
As the chart says, the value of ore mined in Delve in February stood at 13.5 trillion ISK, up substantially from the 8.1 trillion ISK value reported last month.
However, as I always bring up, mining value is based on the current market price of ore and minerals, so if the price spiked the value on the above chart might go up without there being any real change in mining output as measured in m3. So what did the pricing do in last month?
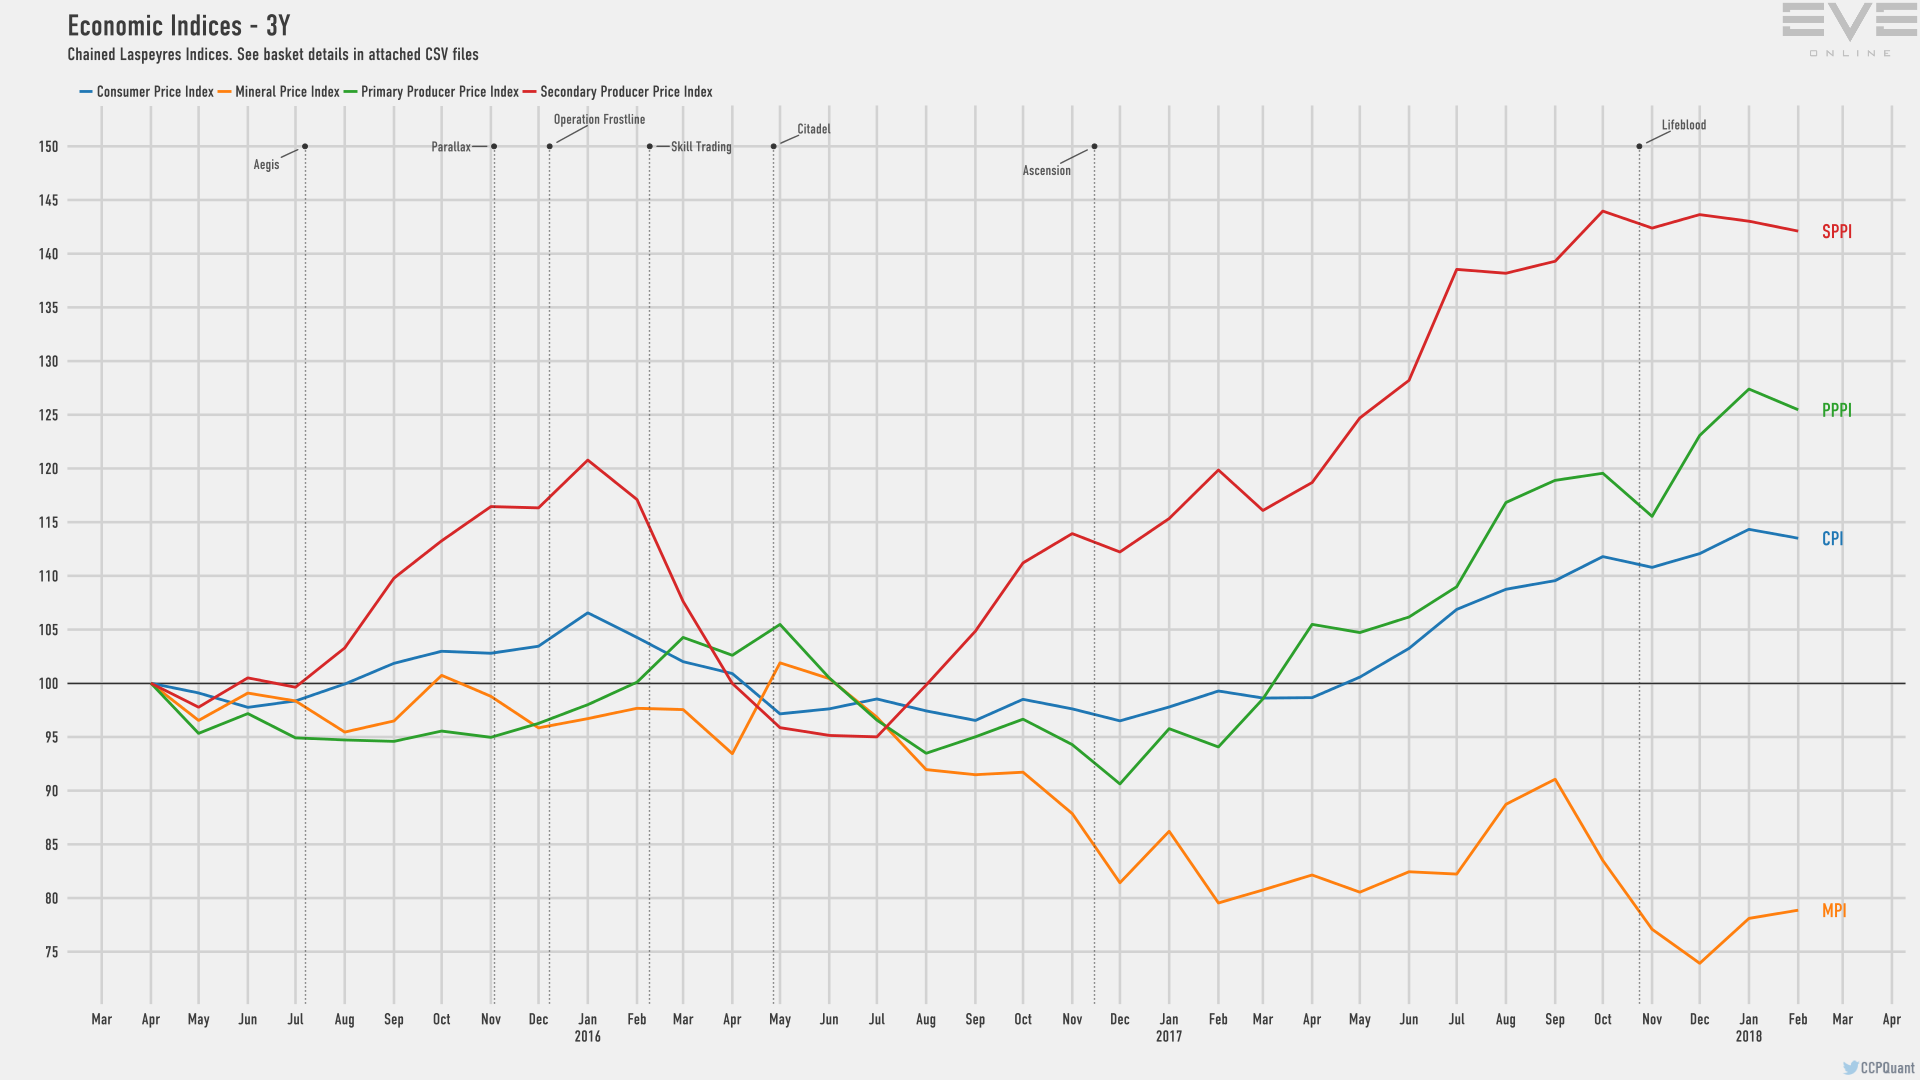
February 2018 – Economic Indices
The price, after having risen some in January, looked to have stayed fairly flat over the last month. Meanwhile, the output for other regions did not change as much.

February 2018 – Mining Value by Region – Bar Graph
Querious and Deklein both saw a bit of an increase, though nothing like the 66% increase that Delve saw. The question is what drove that boost? One theory is that as more moon mining platforms come online, they become a regular part of the yield, helping to increase total value.
Anyway, the Imperium appears to happily mining away in Fortress Delve. And the coalition is looking to expand that. Yesterday was a region-wide moon mining op in Querious. All the moon mining platforms were set to come out together, so the super cap umbrella moved to cover the region as the locust-like swarm of Rorquals descended to strip the moons clean. I haven’t heard anything about the success of the op… other than it started late, so some early risers got the best pickings… but if it went well I expect we will see the number for Querious rising in the March report.
The next boost in Delve, though much smaller than mining, was NPC bounties. With everybody back from the Million Dollar Battle in January, it looks like people went to work to earn ISK to replace those lost fighters.
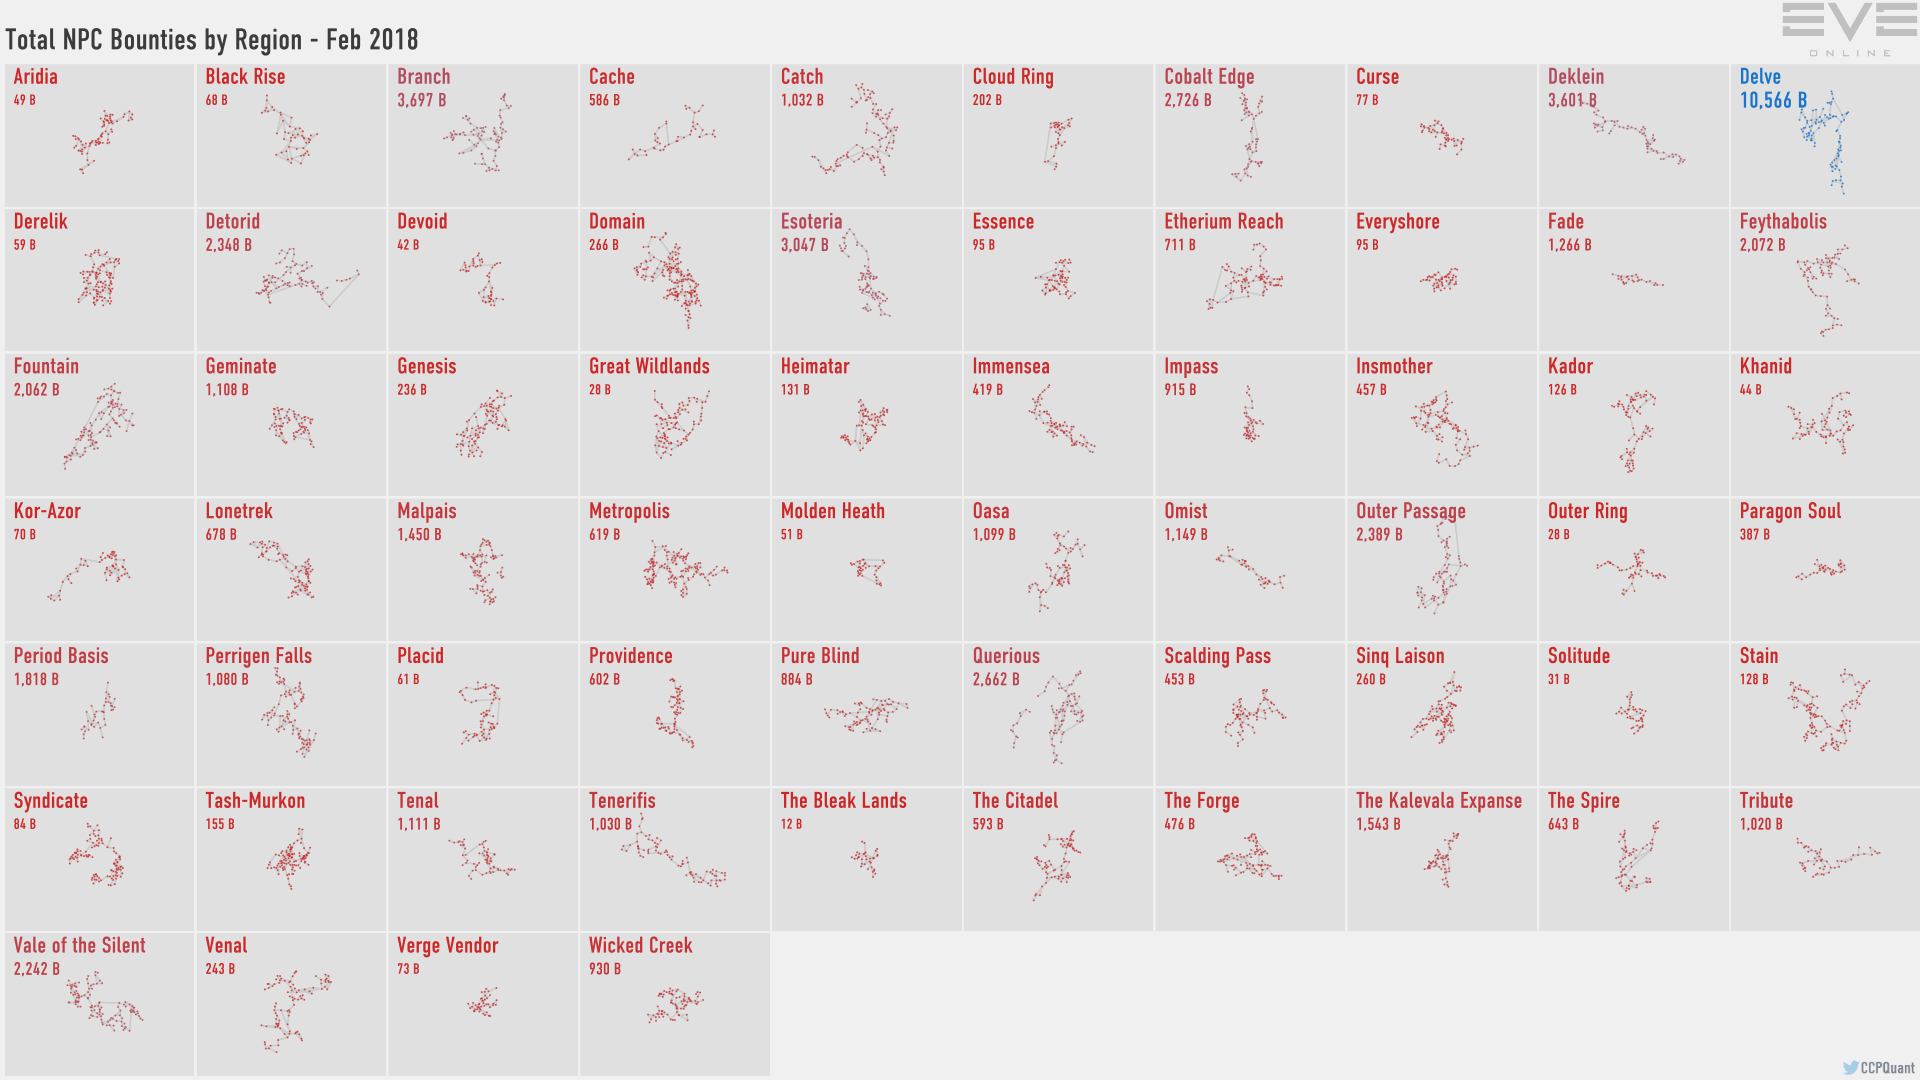
February 2018 – NPC Bounties by Region
That pushed the value of NPC bounties take to 10.5 trillion ISK, up 1.5 trillion from January. Delve remains far and away the largest region for NPC bounties.
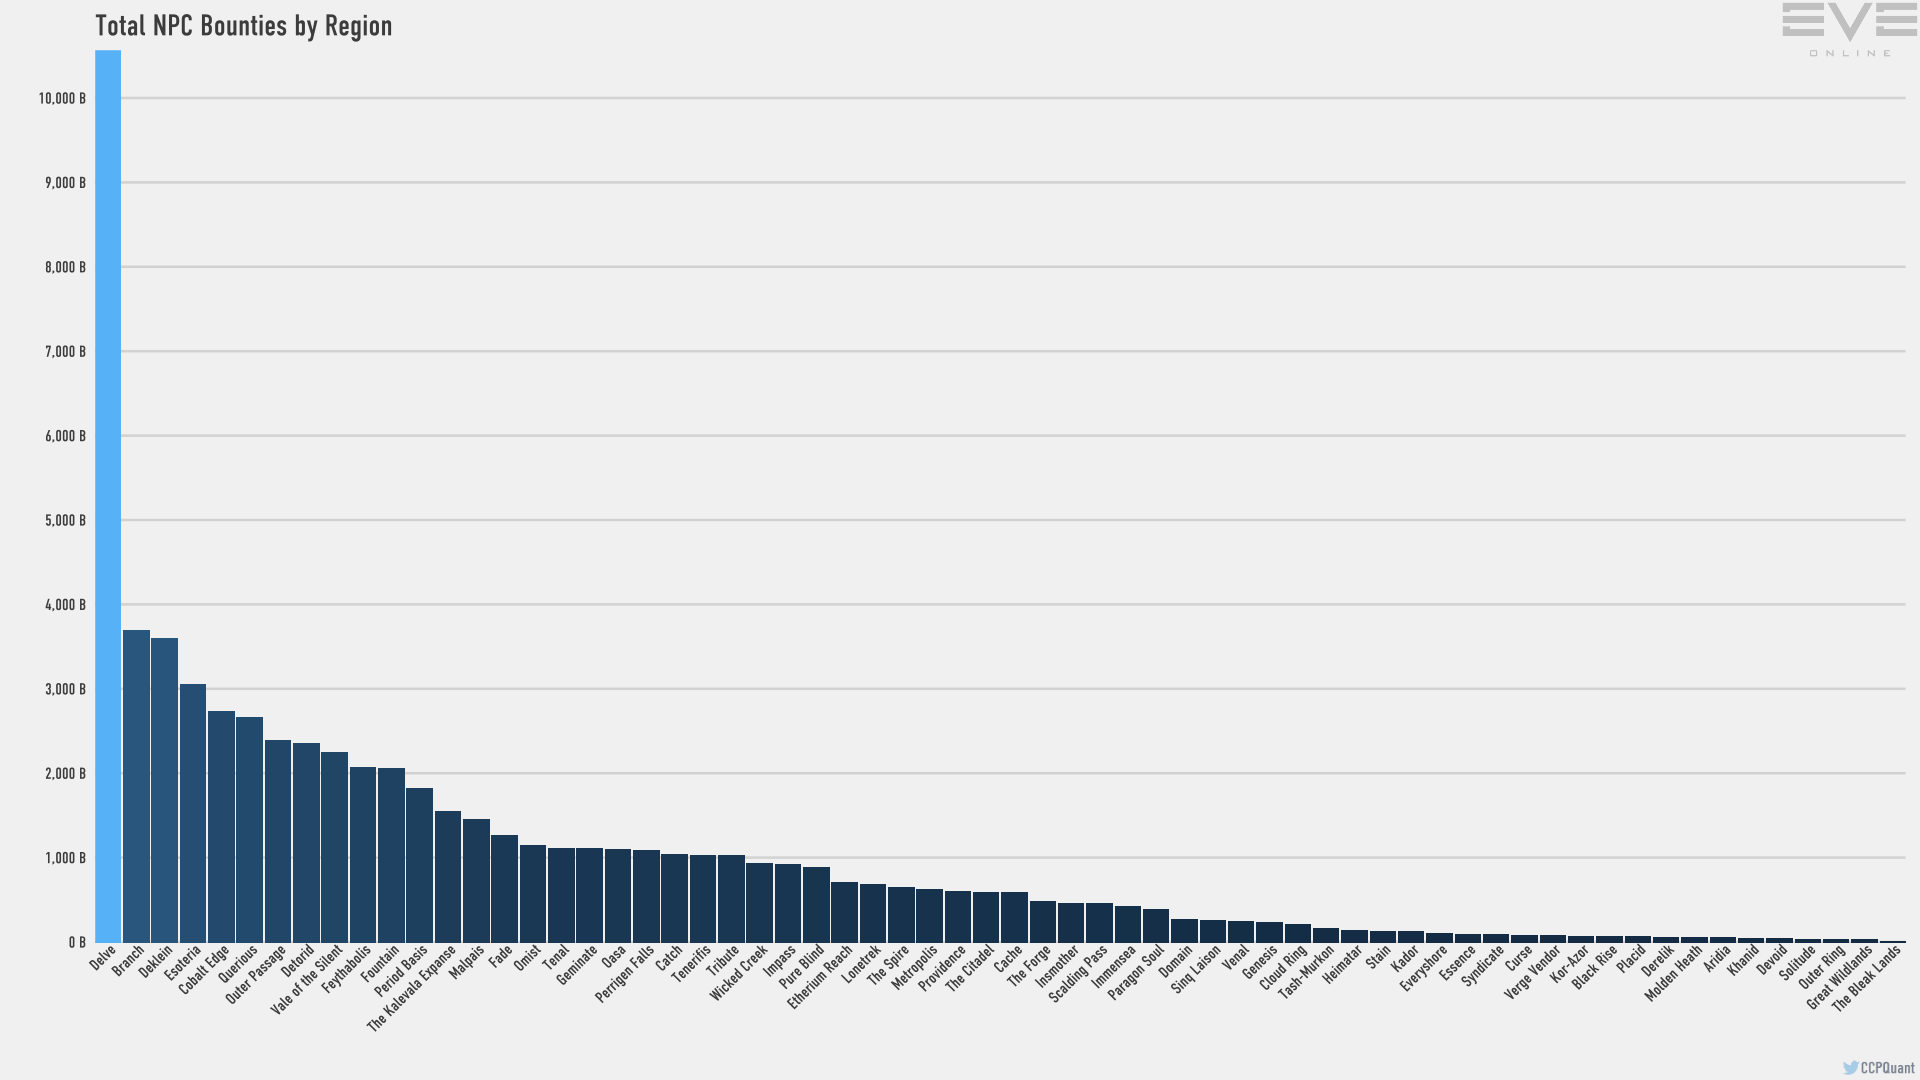
February 2018 – NPC Bounties by Region – Bar Graph
The overall percentage of bounties collected in null sec went up a bit, from 92.8% in January to 93.3% in February.
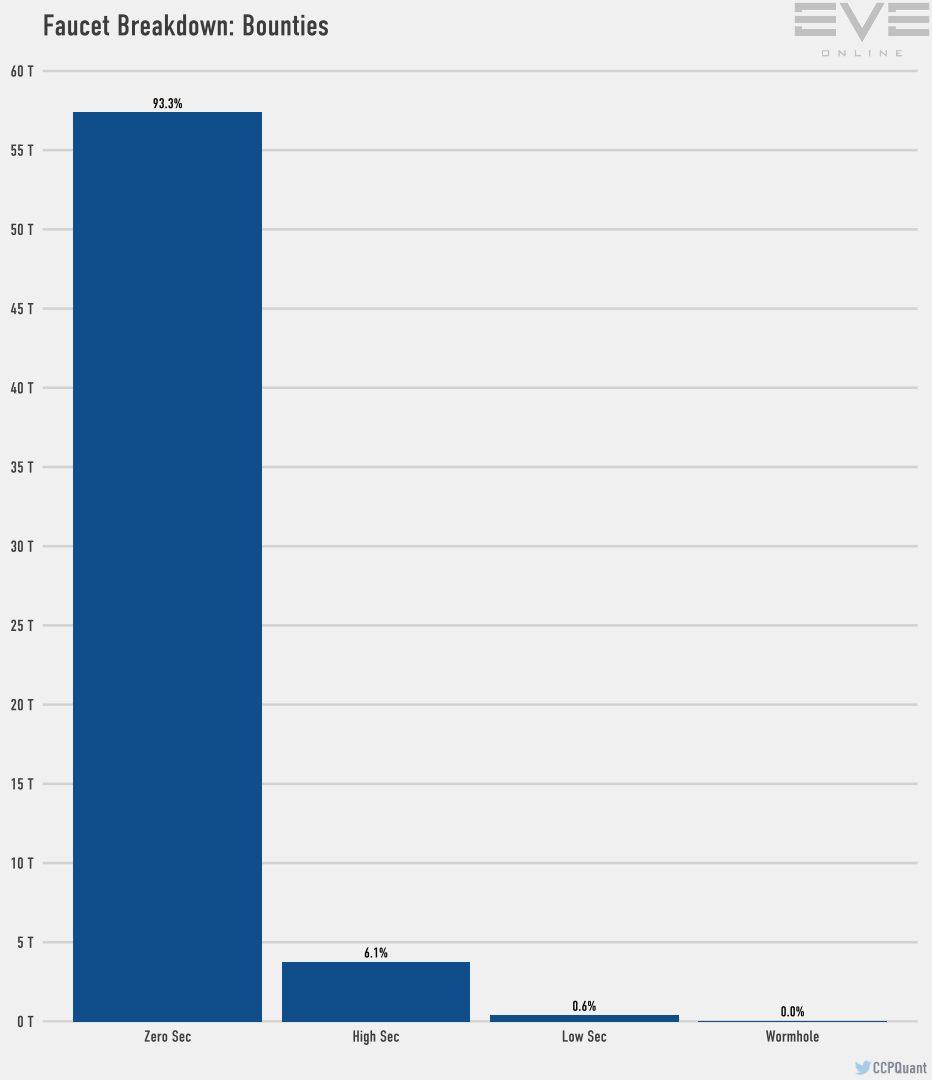
February 2018 – Bounties by Space Sec Rating
I guess that the Guardians Gala event did not spur High Sec to shoot more NPCs.
Overall NPC bounties saw a slight dip in February.
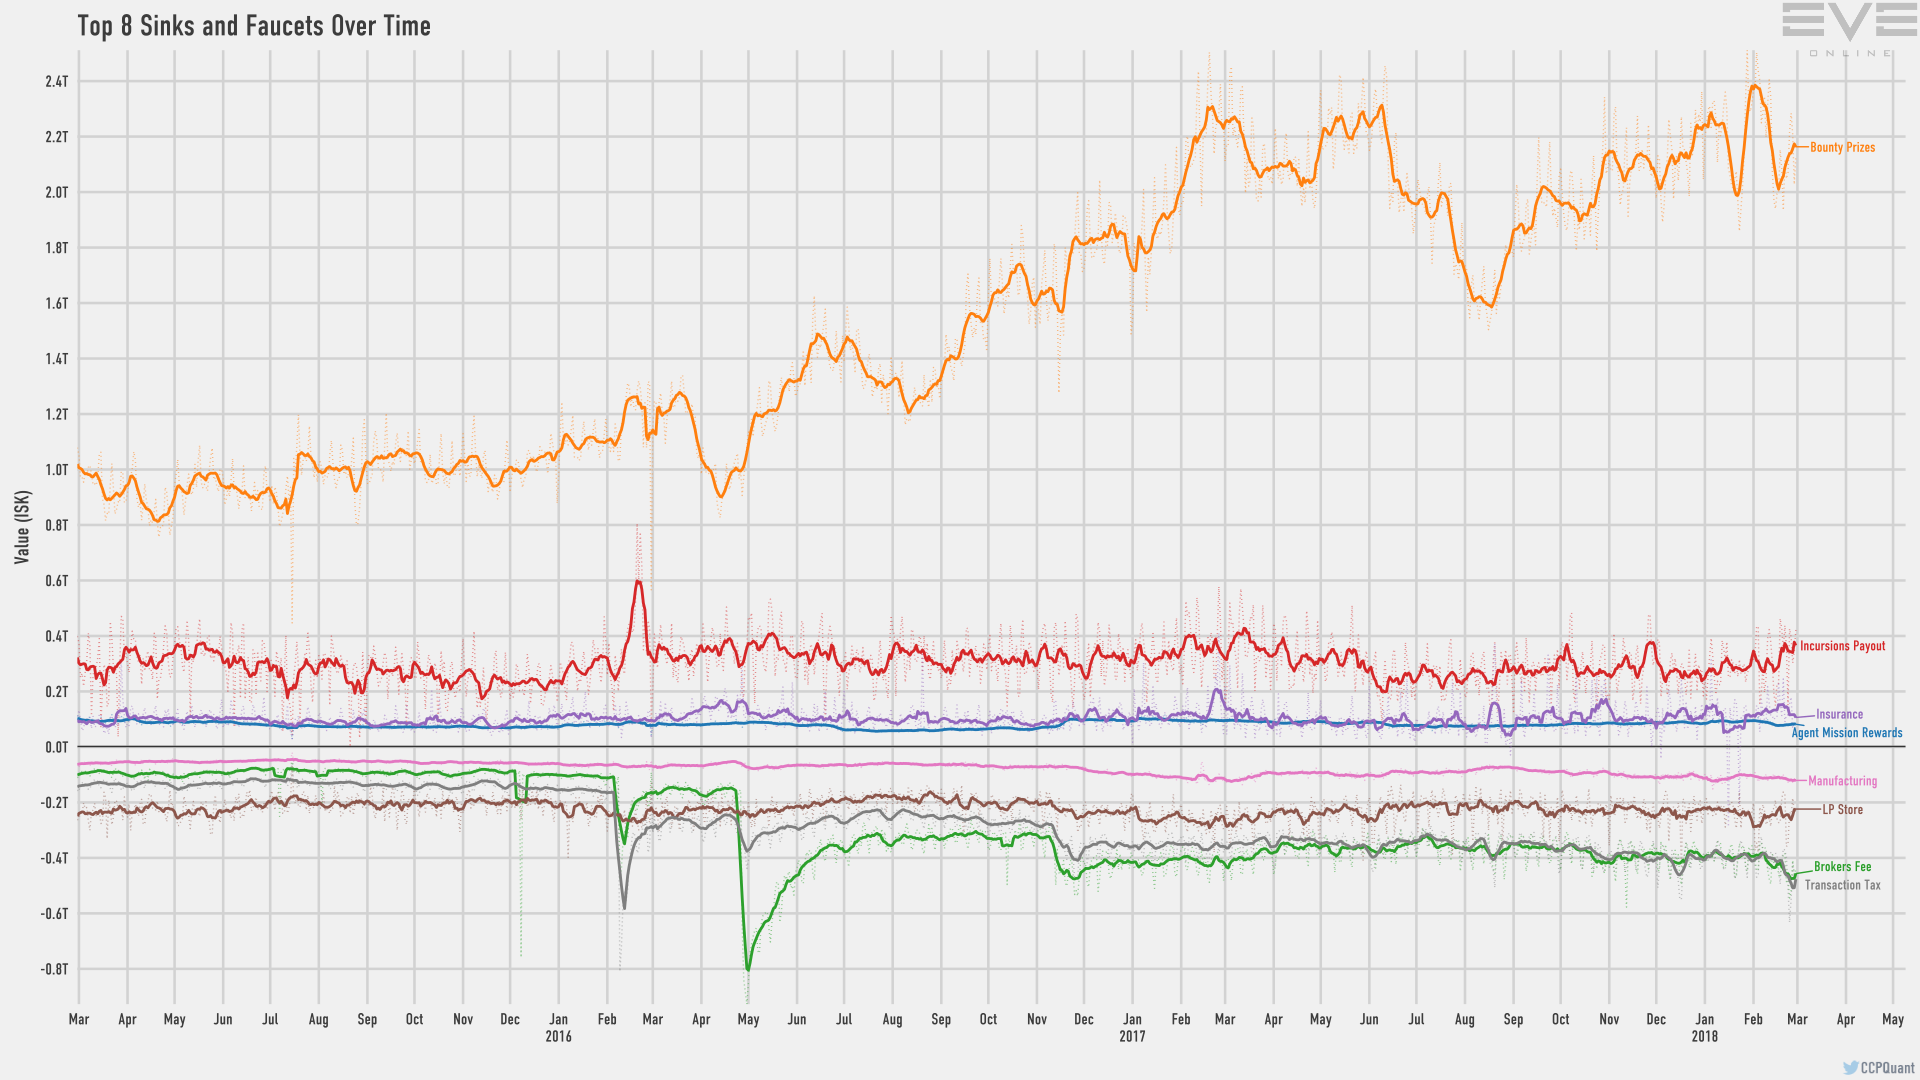
February 2018 – Top 8 ISK Sinks and Faucets
However, the bounties collected remain very high, something CCP seems disinclined to look into.
On the production front, Delve continues to keep pace right behind The Forge in total output, clocking in with 29 trillion ISK to The Forge’s 30 trillion ISK in production.
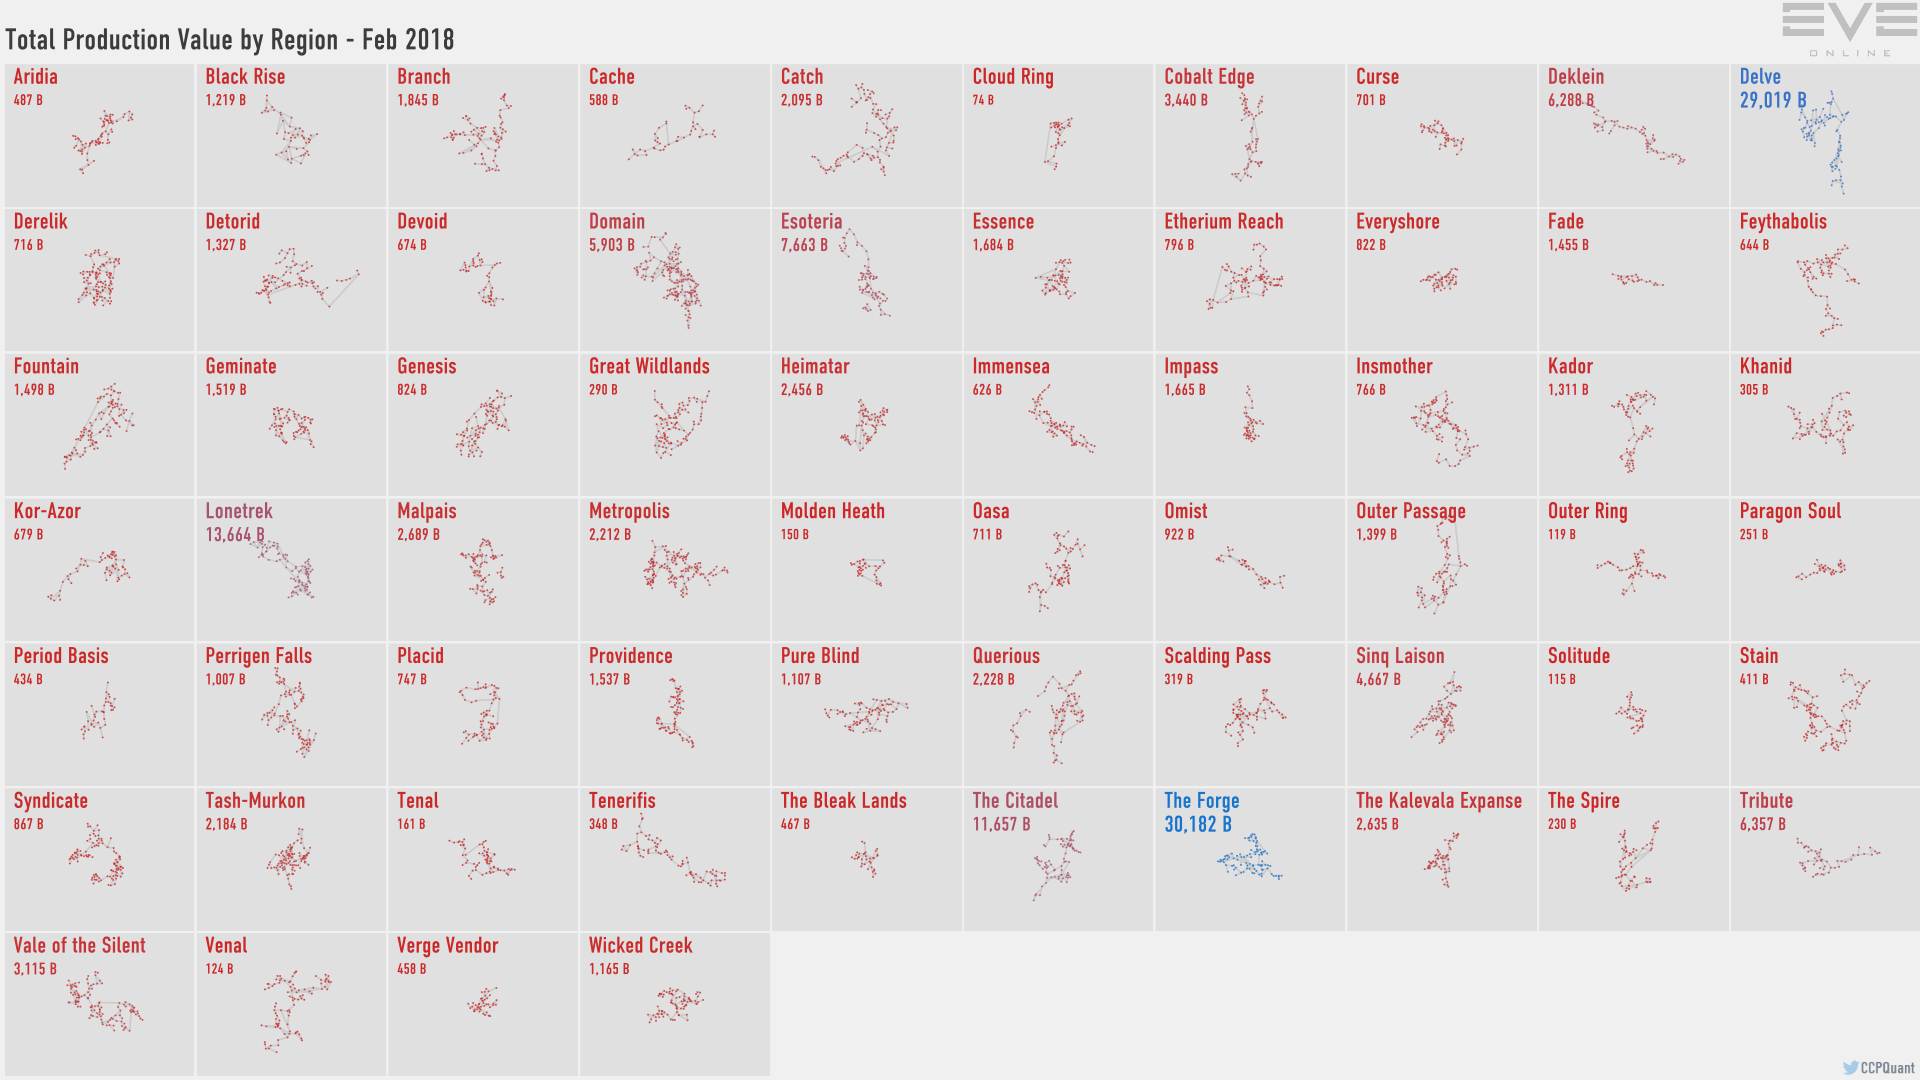
February 2018 – Production Values by Region
That narrowed the gap over last month though, as I point out every month, Jita’s location means that you must include Lonetrek and The Forge as part of the Jita focused economy.
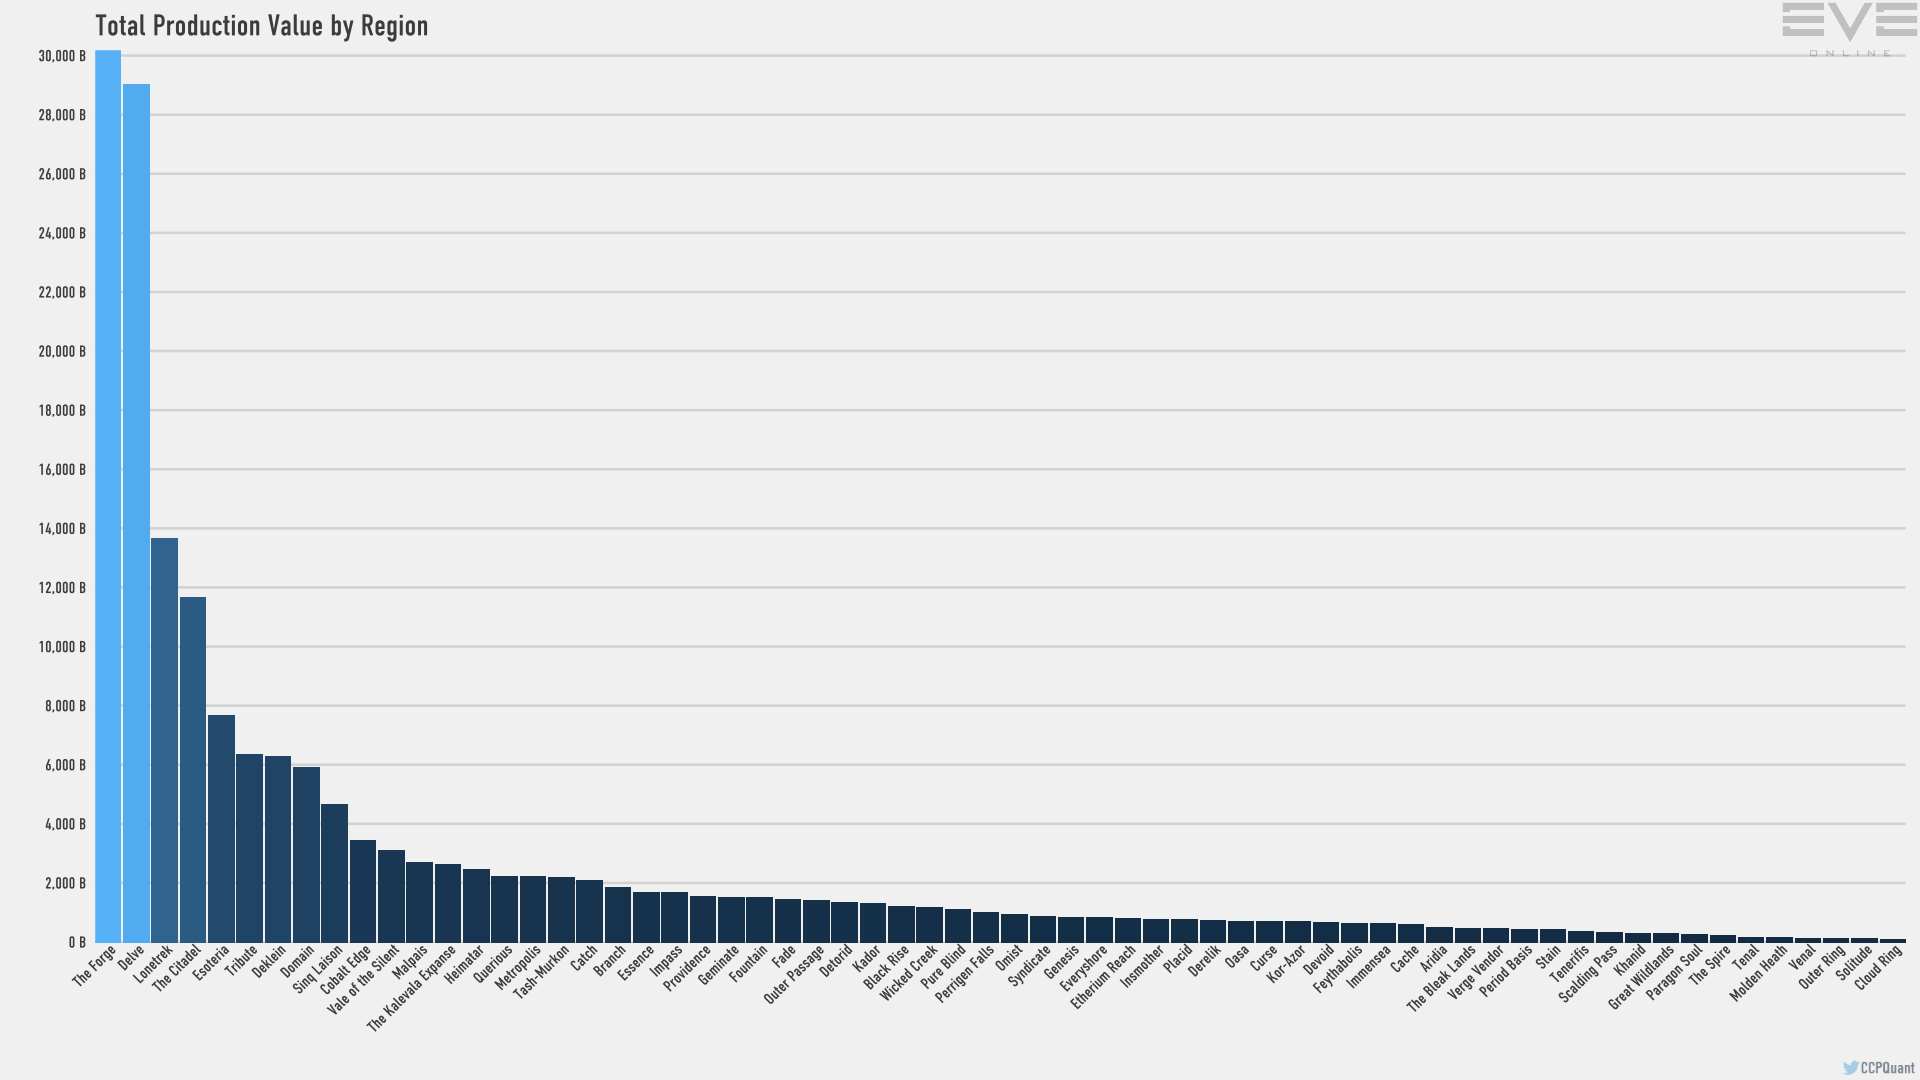
February 2018 – Production Values by Region – Bar Graph
Neither Lonetrek nor The Citadel look like much compared to Delve, but combining them with The Forge gives the three a combined total of over 55 trillion ISK in production output. Jita remains safe on its throne as the king of commerce in New Eden, and all the more so when the trade value charts are explores.
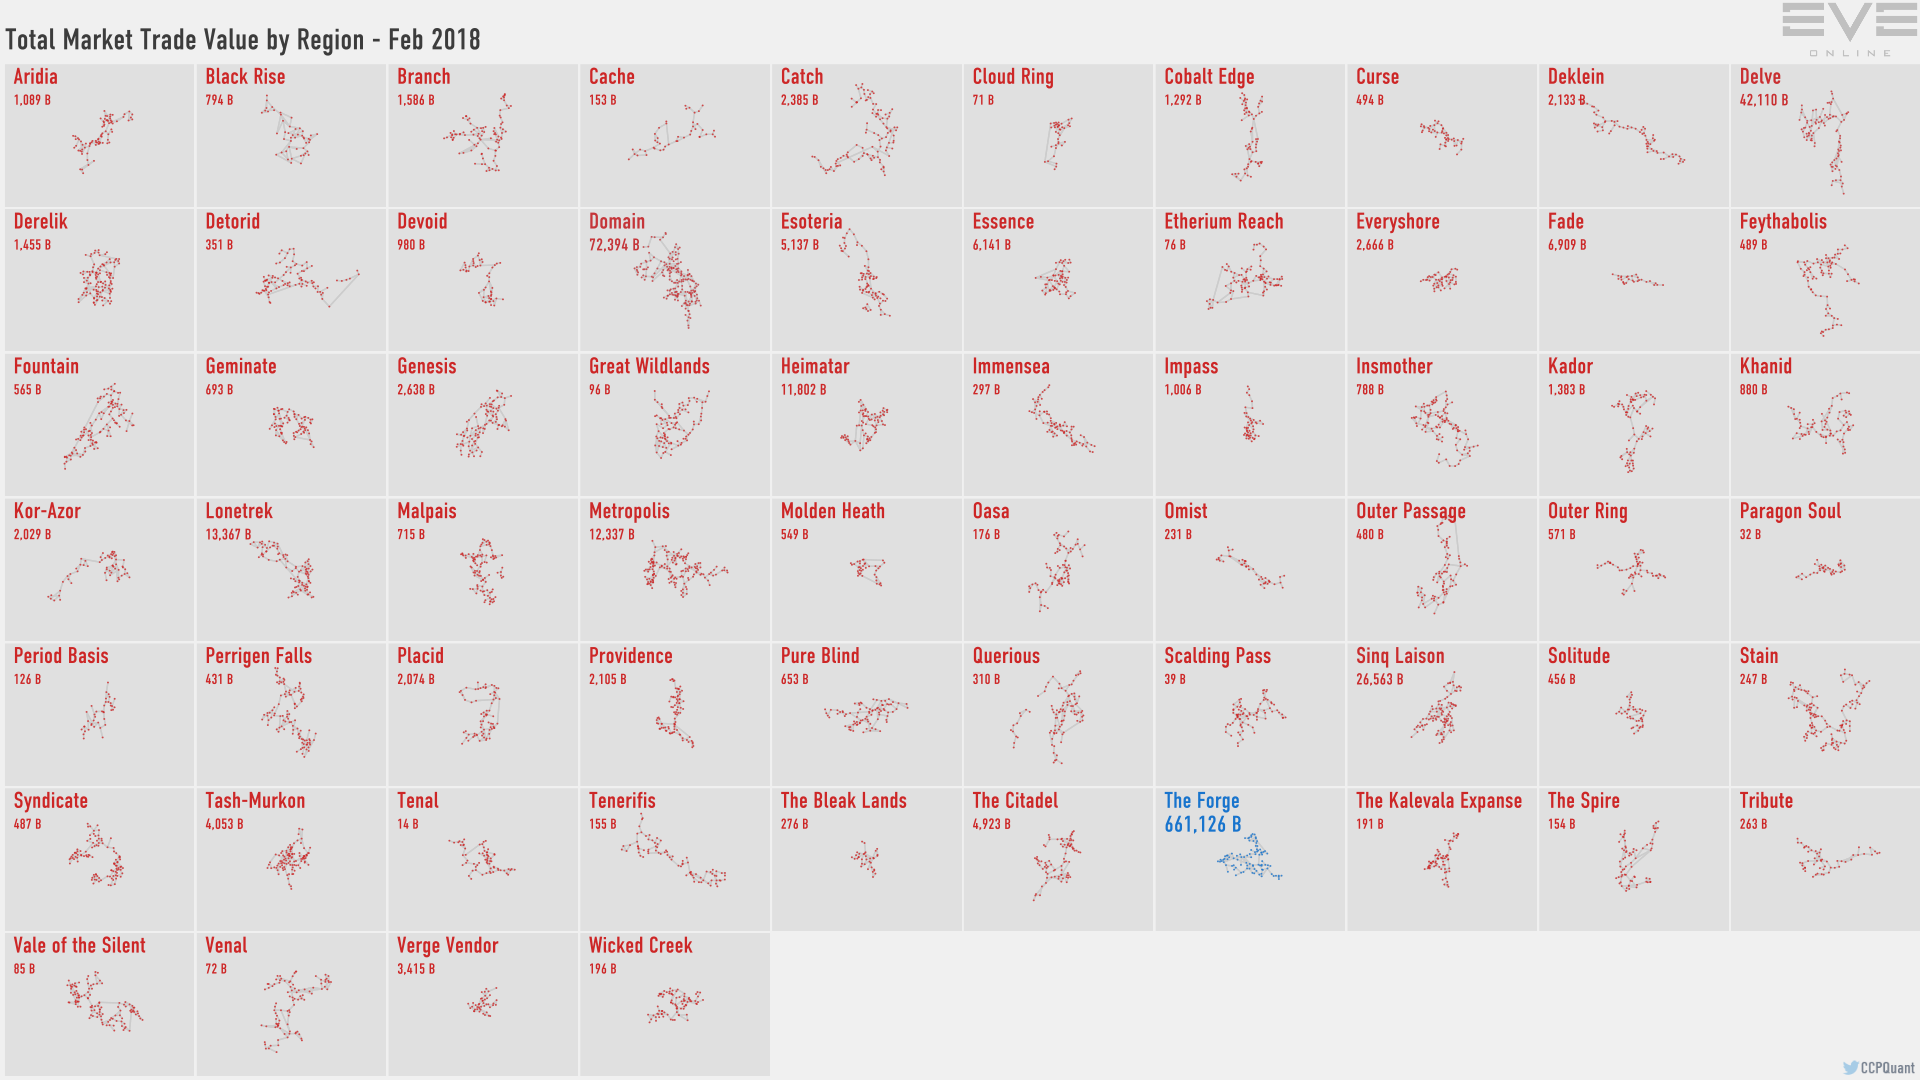
February 2018 – Trade Value by Region
The Forge, hosting Jita (and Perimeter), adds up to a total of 661 trillion ISK in trading value, a number so big that it dominates the bar graph pretty handily.
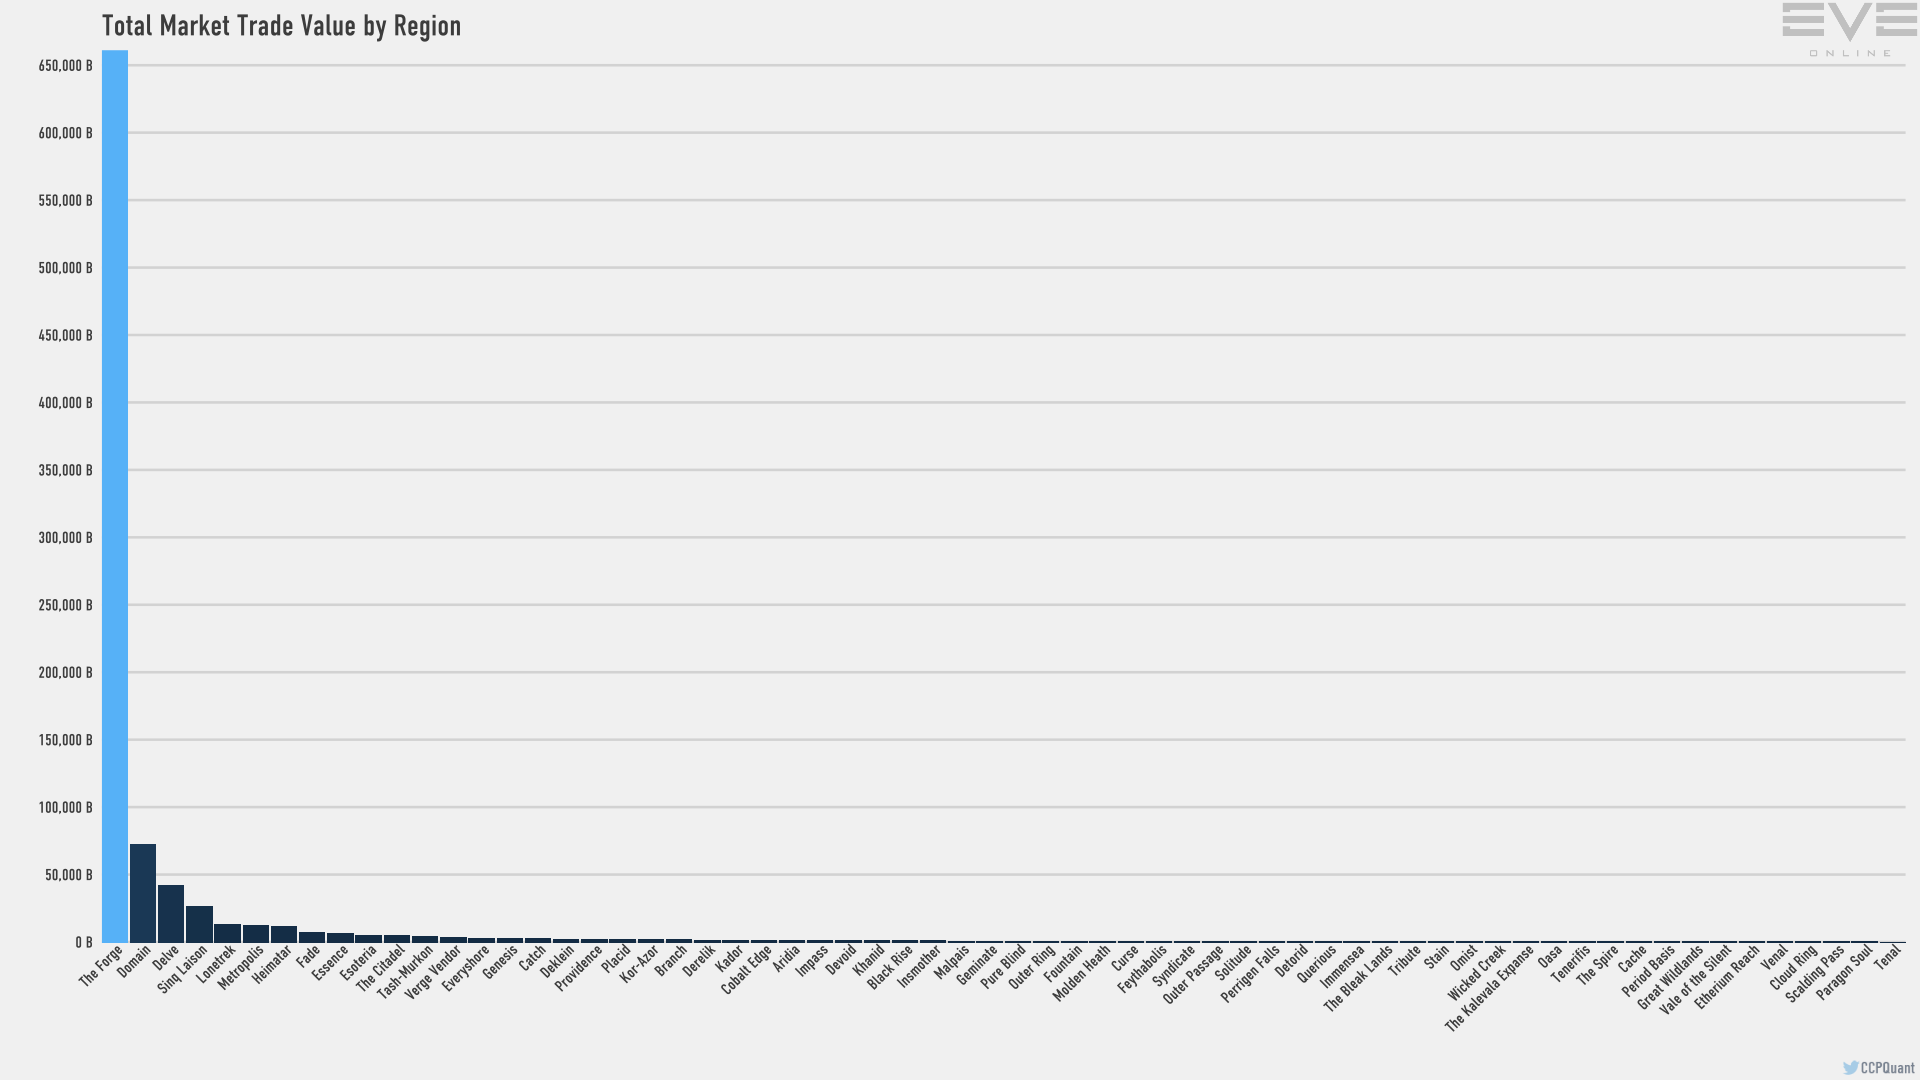
February 2018 – Trade Value by Region – Bar Graph
The bar graph without The Forge better shows the granularity of the other regions.
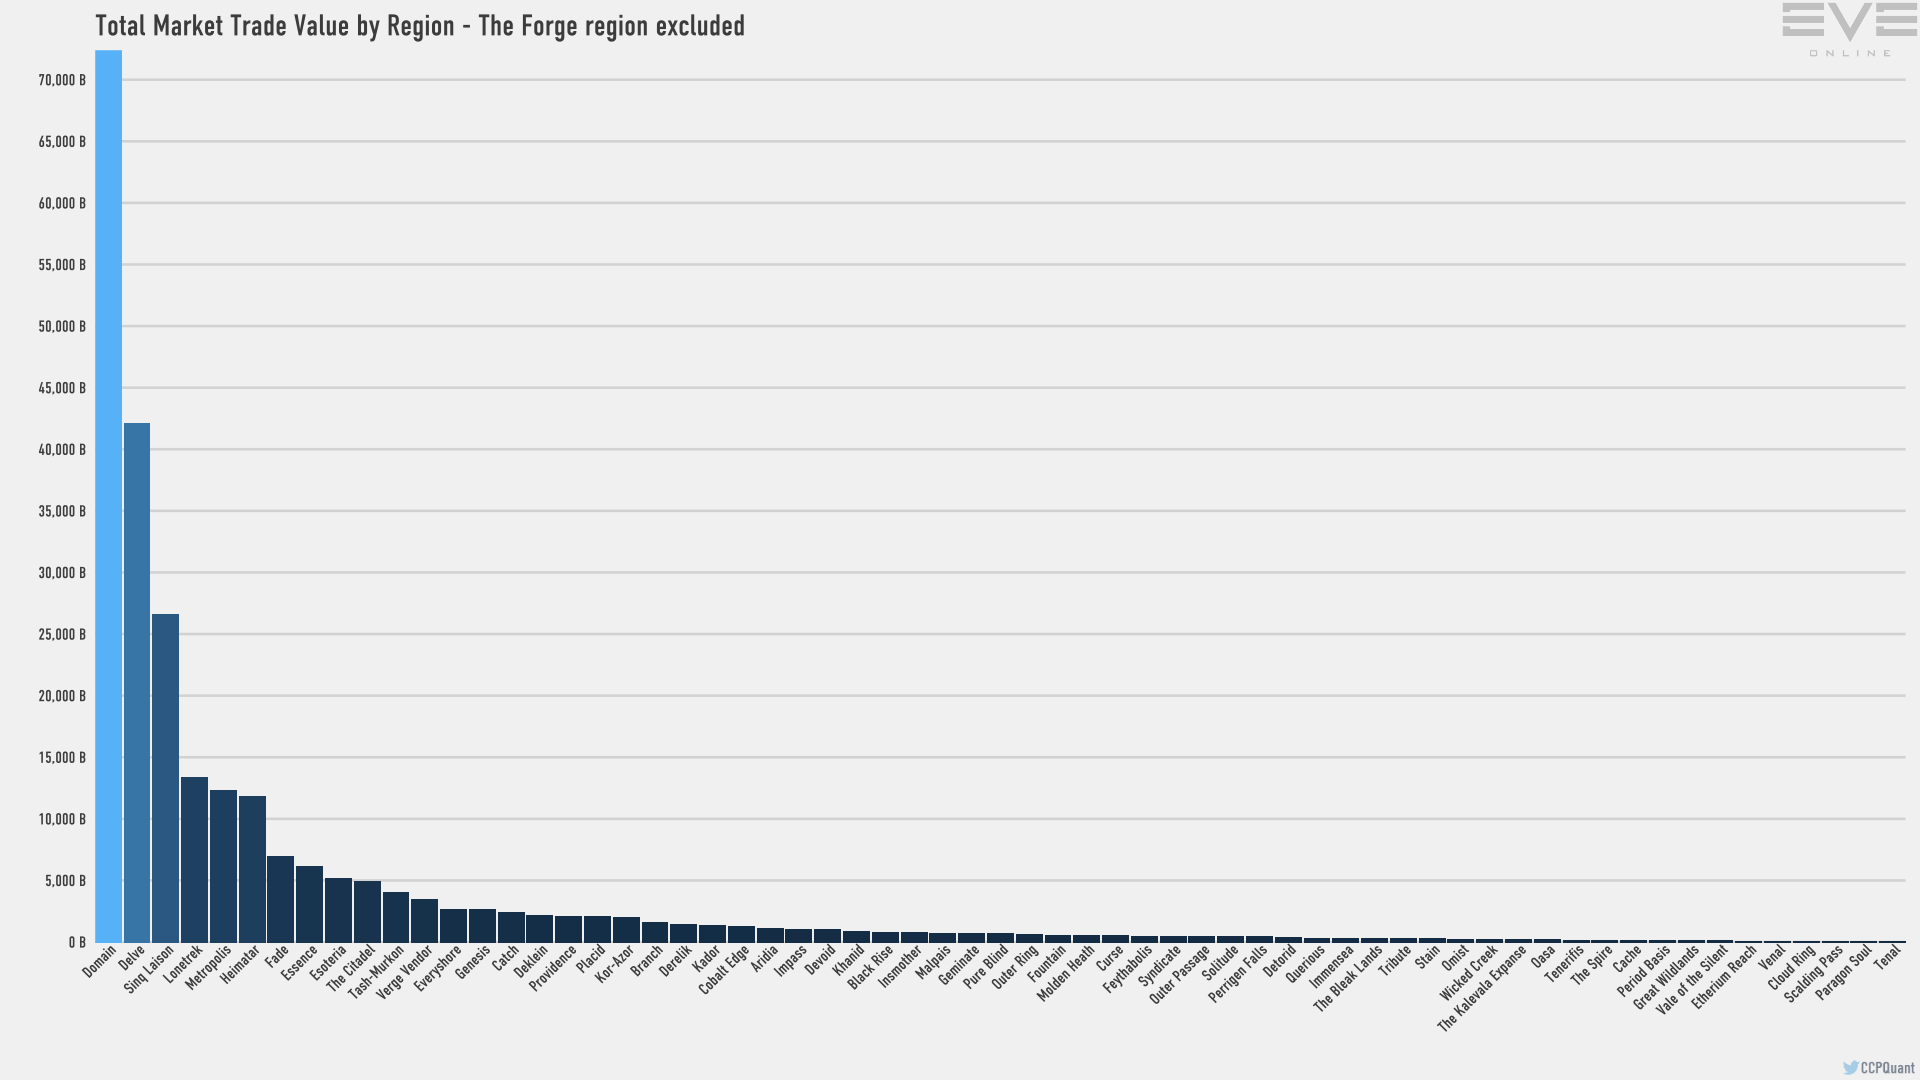
February 2018 – Trade Value by Region – Bar Graph, Forge Excluded
Without The Forge, Domain, home to Amarr, is the top trading destination, with Delve coming in third, ahead of the lesser high sec trade hubs.
Then there is the regional stats comparison graph that I like to look at every month just to get a high level view of some of the key regions.
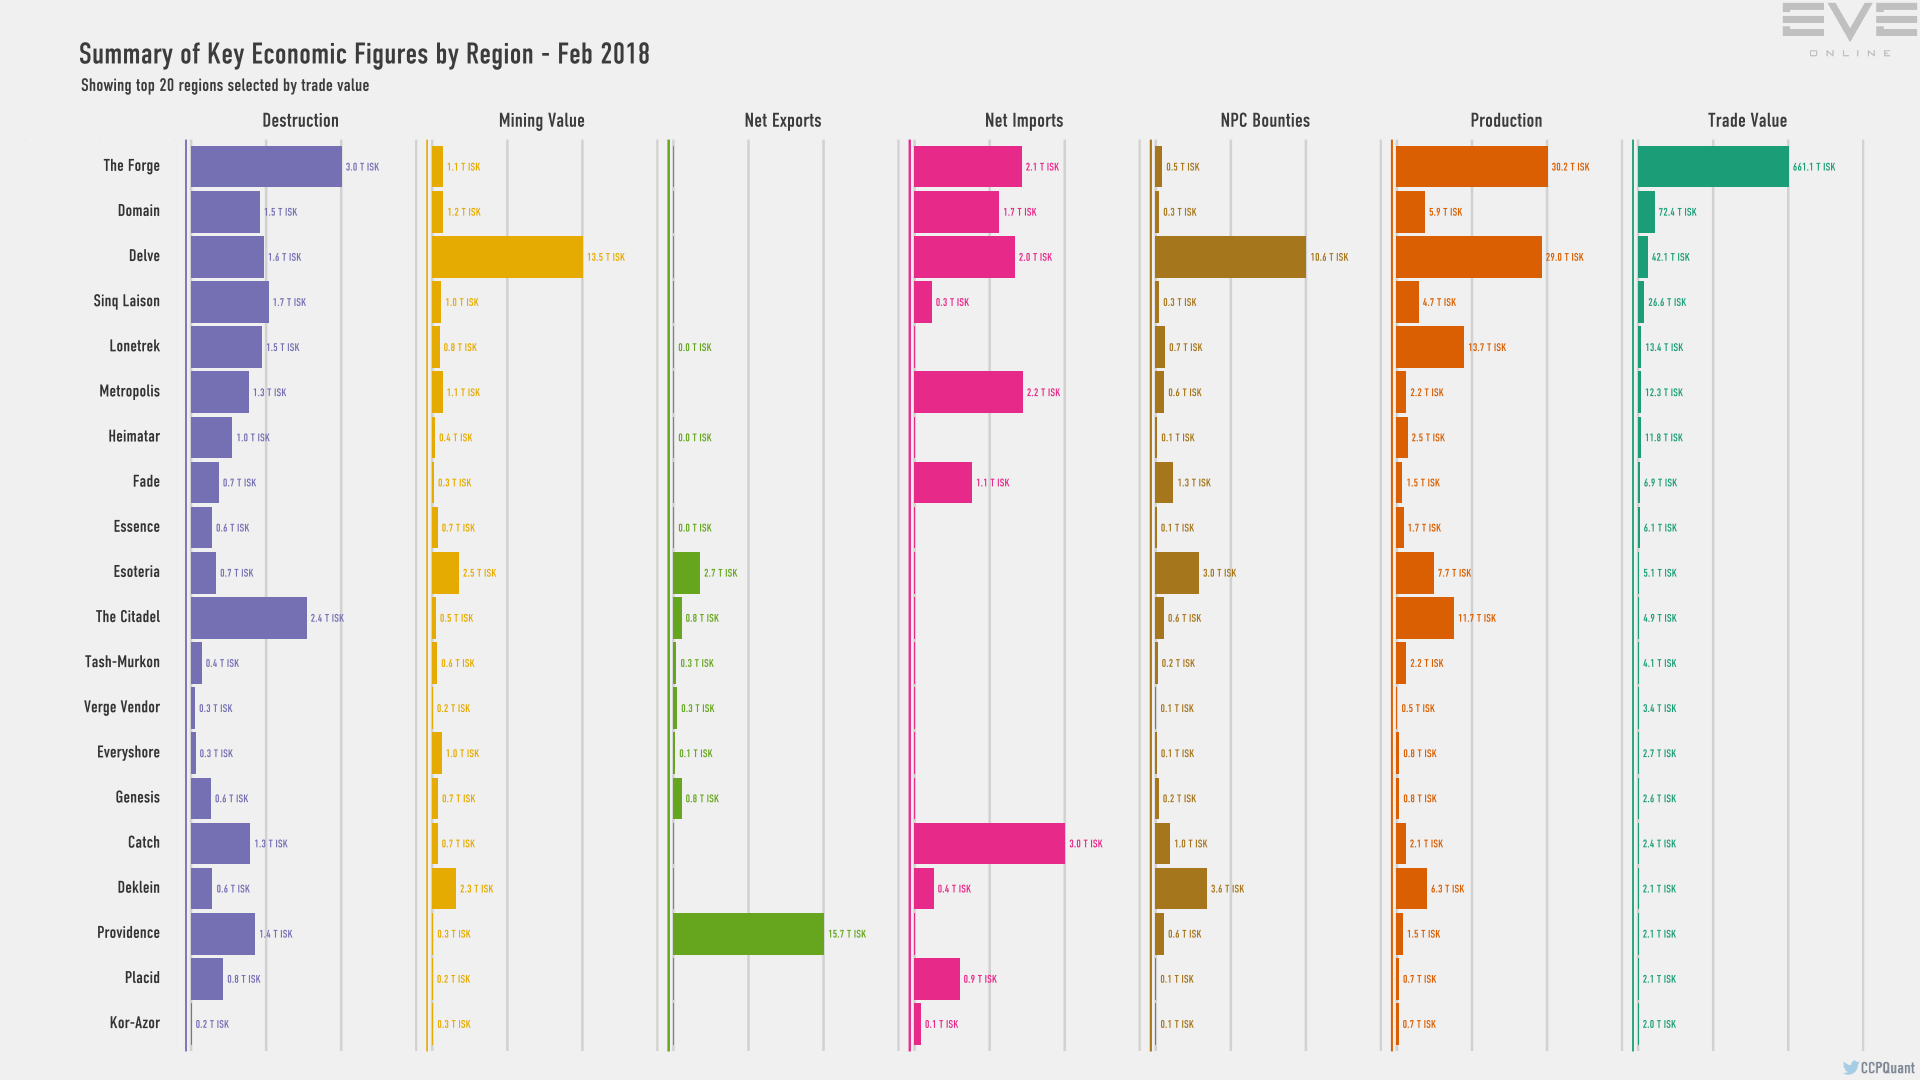
February 2018 – Regional Summary Stats
Finally, the bonus graph this month has to be the Trade Balance graph.
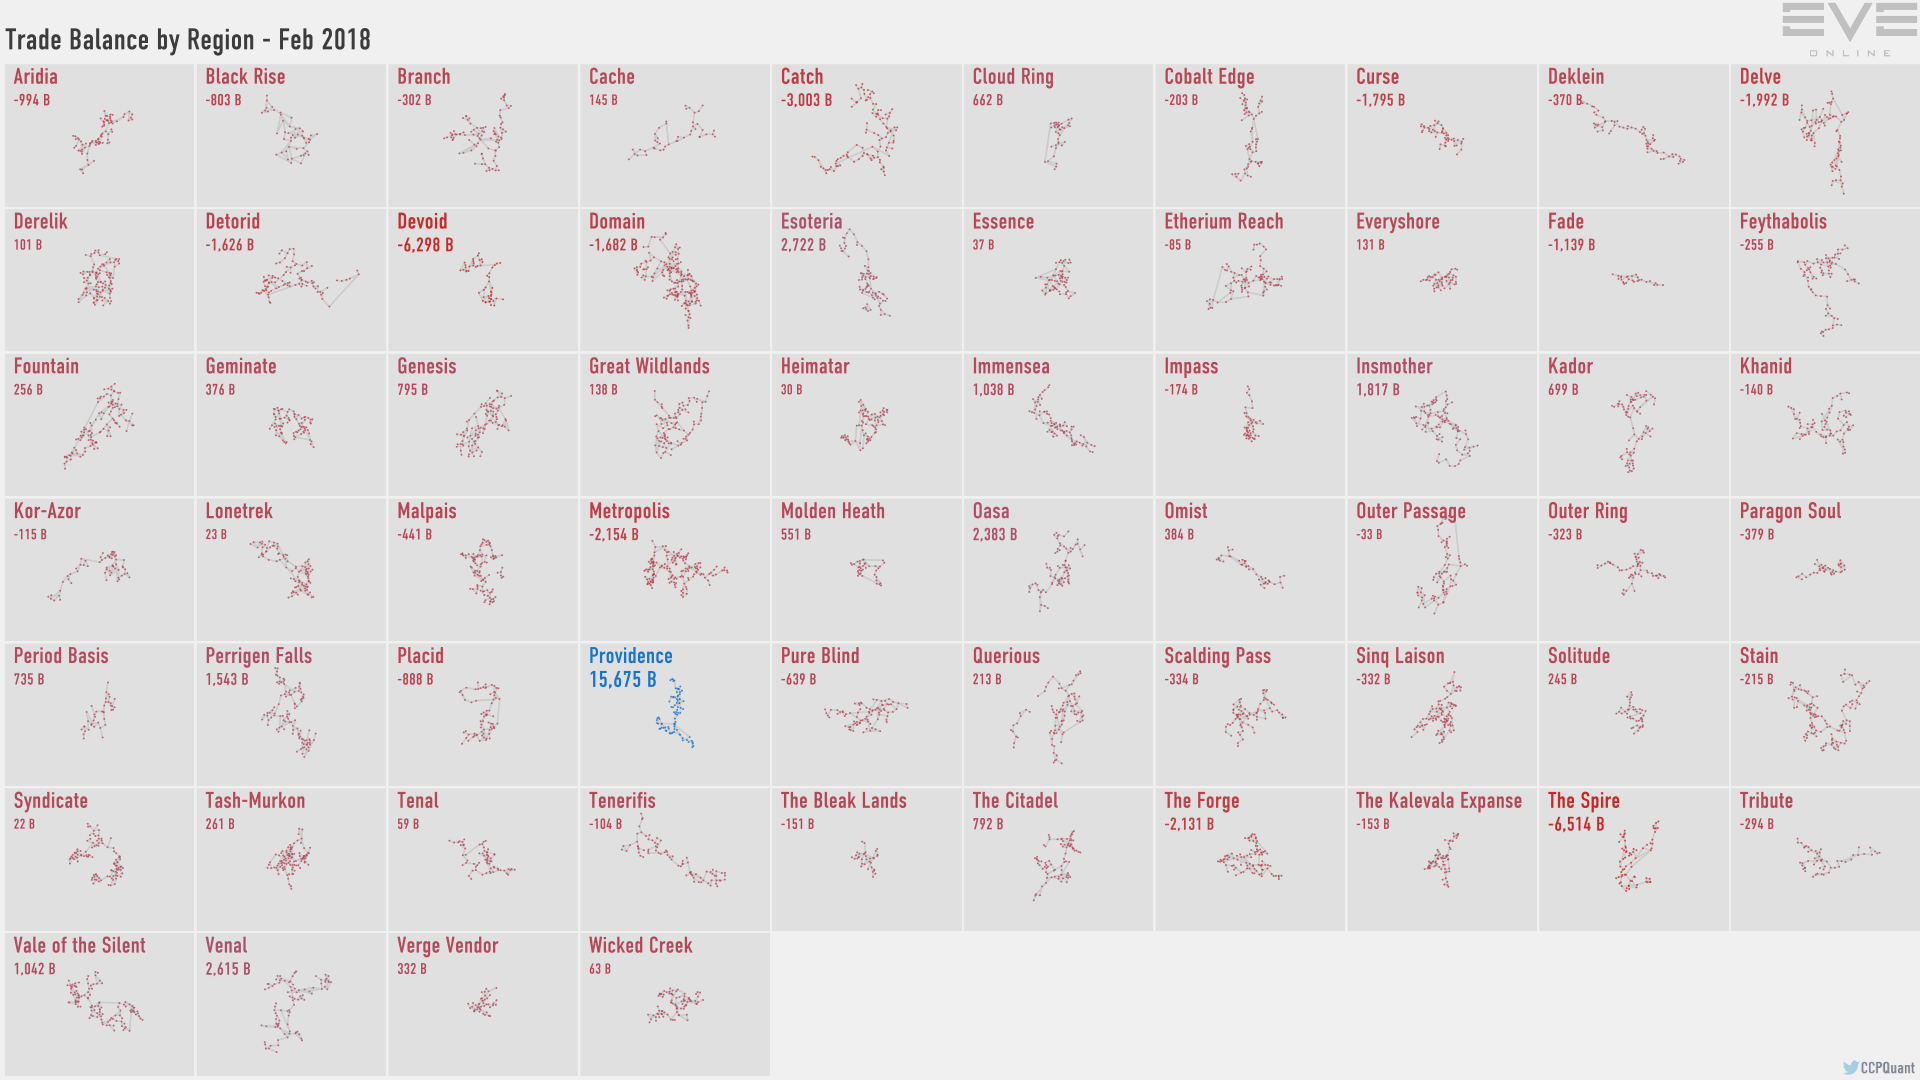
Feb 2018 – Trade Balance by Region
The interesting item there is Providence, which exported 15.675 trillion ISK in February.
That represents the evacuation of assets by Provi-bloc, which seems to be crumbling in the face of the onslaught by Pandemic Legion and NCDot. So, in addition to the hole in the north left by Pandemic Horde moving from Fade and Pure Blind to Geminate, there looks like there will be a change in Providence as PanFam continues its drive there.
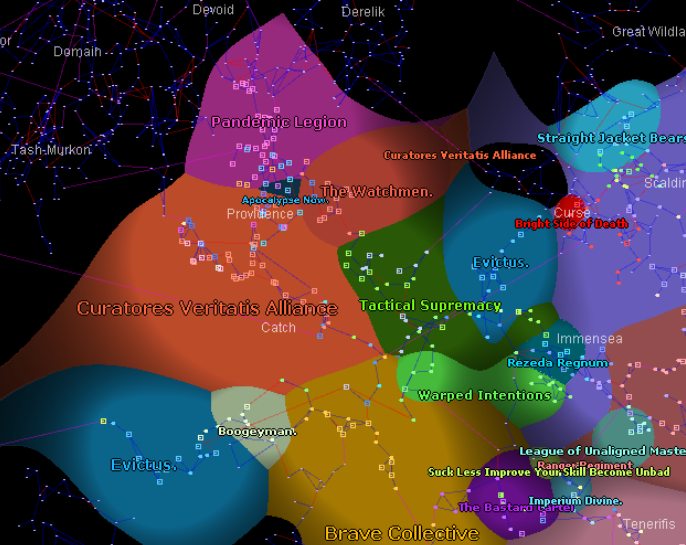
PL owns the north of Providence now
That puts PL closer to the Legacy Coalition, which includes TEST and Brave, both favorite targets of PanFam in the past, as well as being much closer to Querious and Delve. We will see what happens with that.
And we will also see next month what impact Burn Jita had, if any, on the economy of New Eden.
The monthly economic report is available as a dev blog and contains more charts than I have shown as well as the raw data used to generate them, if you want to roll your own.
No comments:
Post a Comment