CCP released the Monthly Economic Report for August earlier this week. As with last month the effects of the current war is probably the most interesting thing to examine in the numbers. June was the last month of relative peace (as in the real world, New Eden is never all at rest) so the numbers for July and August show some of the impact of the war.
As with last month, we might as well jump straight into mining.

August 2018 – Mining Value by Region
By the numbers mining saw a rebound in Delve, home of the Imperium, and the most heavily mined region in New Eden. The value of ore mined went from 8 trillion to 11 trillion ISK. That brings it closer to the 14 trillion ISK worth of ore that was mined in June.
However, the value of ore is based in part on the market. If the price goes up the value mined in a region will go up as well, all other factors being equal, and we did indeed see a jump in ore prices in August.

August 2018 – Economic Indices
As you can see from the above chart, mineral prices, while still down from the most recent peak, did rise sharply. Other regions saw similar upticks, including Querious, one of the subsidiary regions of the Imperium.
Driving this is likely the need to replace ships being destroyed in the war.

August 2018 – Destroyed Value by Region
The July numbers saw almost 4 trillion ISK destroyed in Tenerifis in the battles around the TEST Keepstars in the south.
In August the main front of the war moved north, to Pure Blind. The battles around the armor timer and the final timer of the Keepstar in X47L-Q helped drive the level of destruction in the region past 10 trillion ISK. While both sides have ISK in adequate supply to replace these losses, but ISK doesn’t build ships. For that you need ore, and with a lot more ISK chasing the mining output of New Eden, prices have been on the rise.
That level of loss made the usual high level of destruction around Jita, where ganks and interdiction campaigns congregate, fade into the background.
On the ISK front things were more stable.

August 2018 – NPC Bounties by Region
Delve remains at the front of the pack, though NPC bounty payouts fell by half a trillion ISK compared to July (and by more than 4 trillion ISK compared to June) as Imperium pilots find themselves deployed to the north.
The big gain in was in the Branch region, where Guardians of the Galaxy goes to krab. There bounty payments rose from 4.2 trillion ISK in July to 5.1 trillion ISK in August. Most other areas were flat in output, though the Tenal region in the north did see a half a trillion ISK drop.
NPC bounty payments swung a bit further into the favor of null sec.

August 2018 – NPC Bounties by Sec Status
High sec was at 6.8% in July, but dropped to 6% for August. Given the general flat output of null sec for the month I wonder if the Secrets of the Abyss event that landed with last month’s update drew high sec pilots to that as opposed to missions.
Overall, ratting ebbed and flowed as battles drew people away from anomalies over the course of the month.
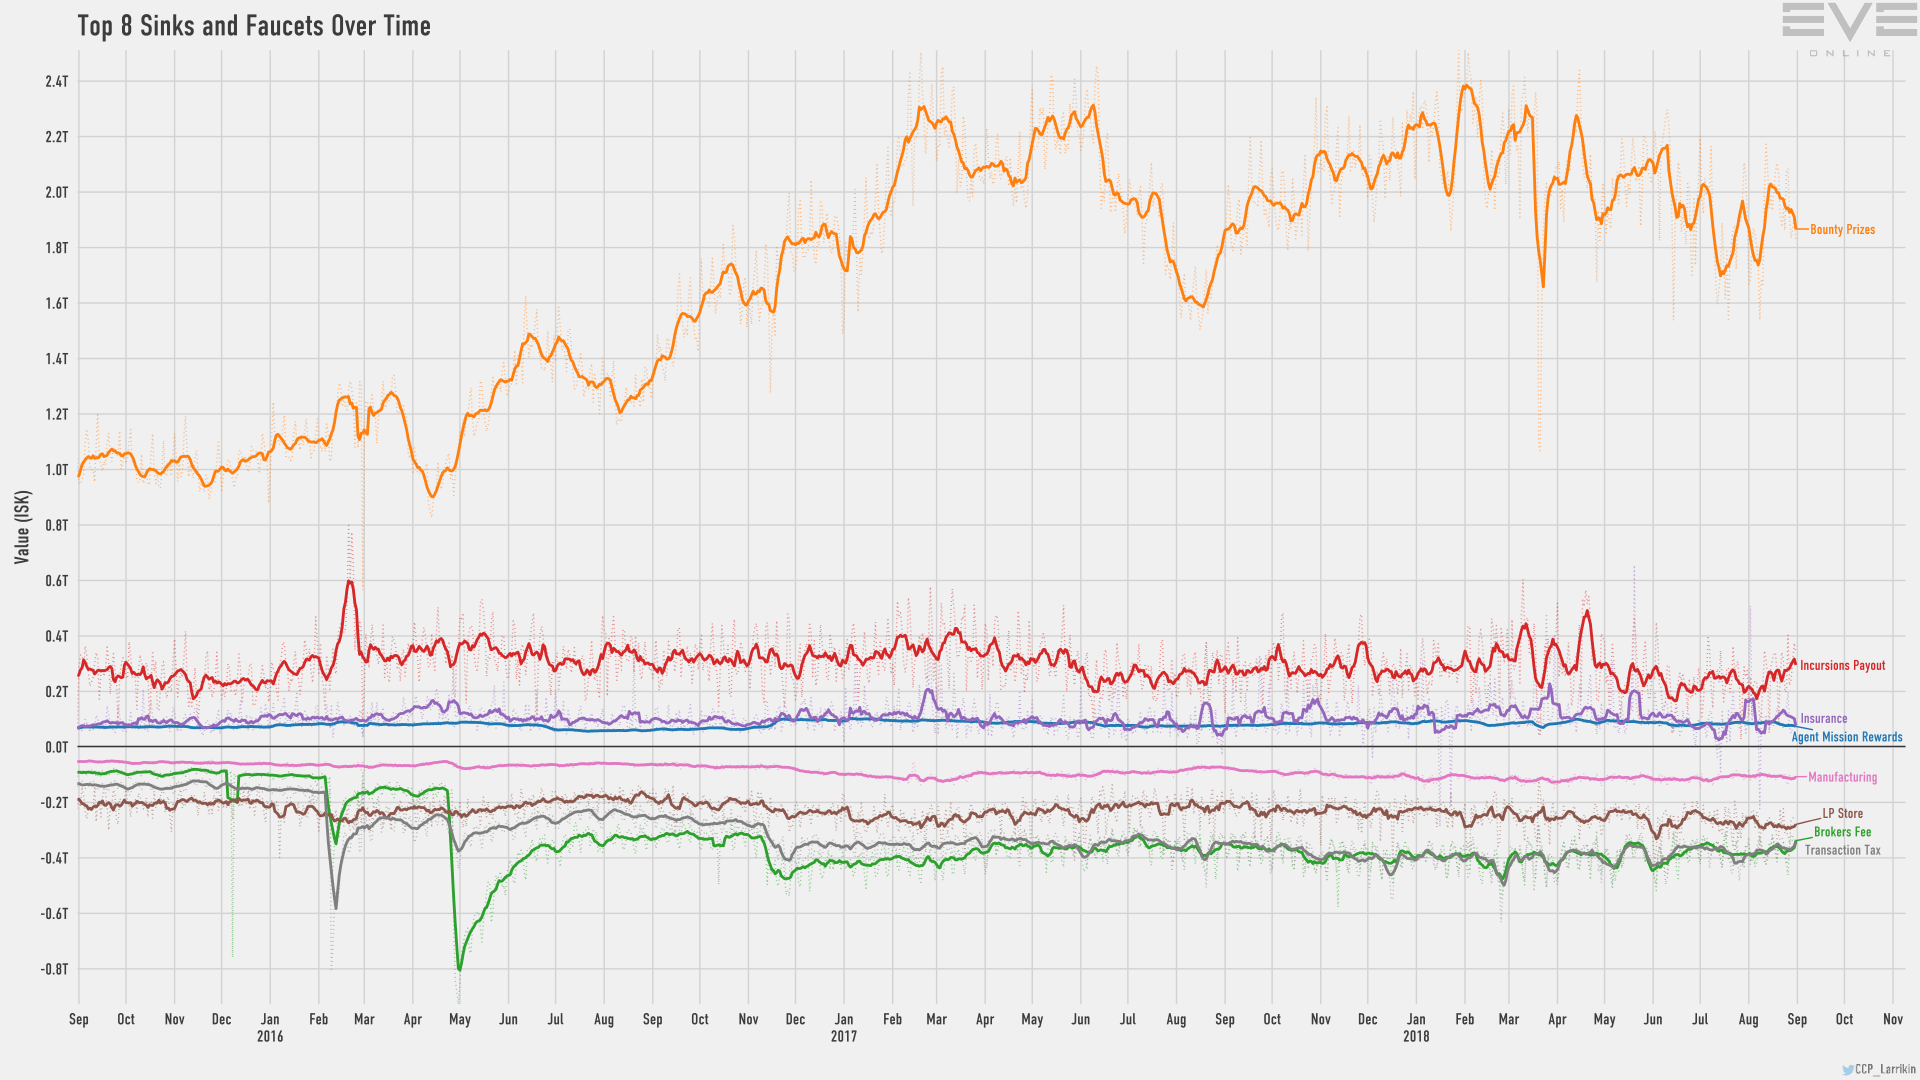
August 2018 – Top 8 ISK Sinks and Faucets
In supporting a war there ought to be signs of the supply chain in action in the trade value numbers.

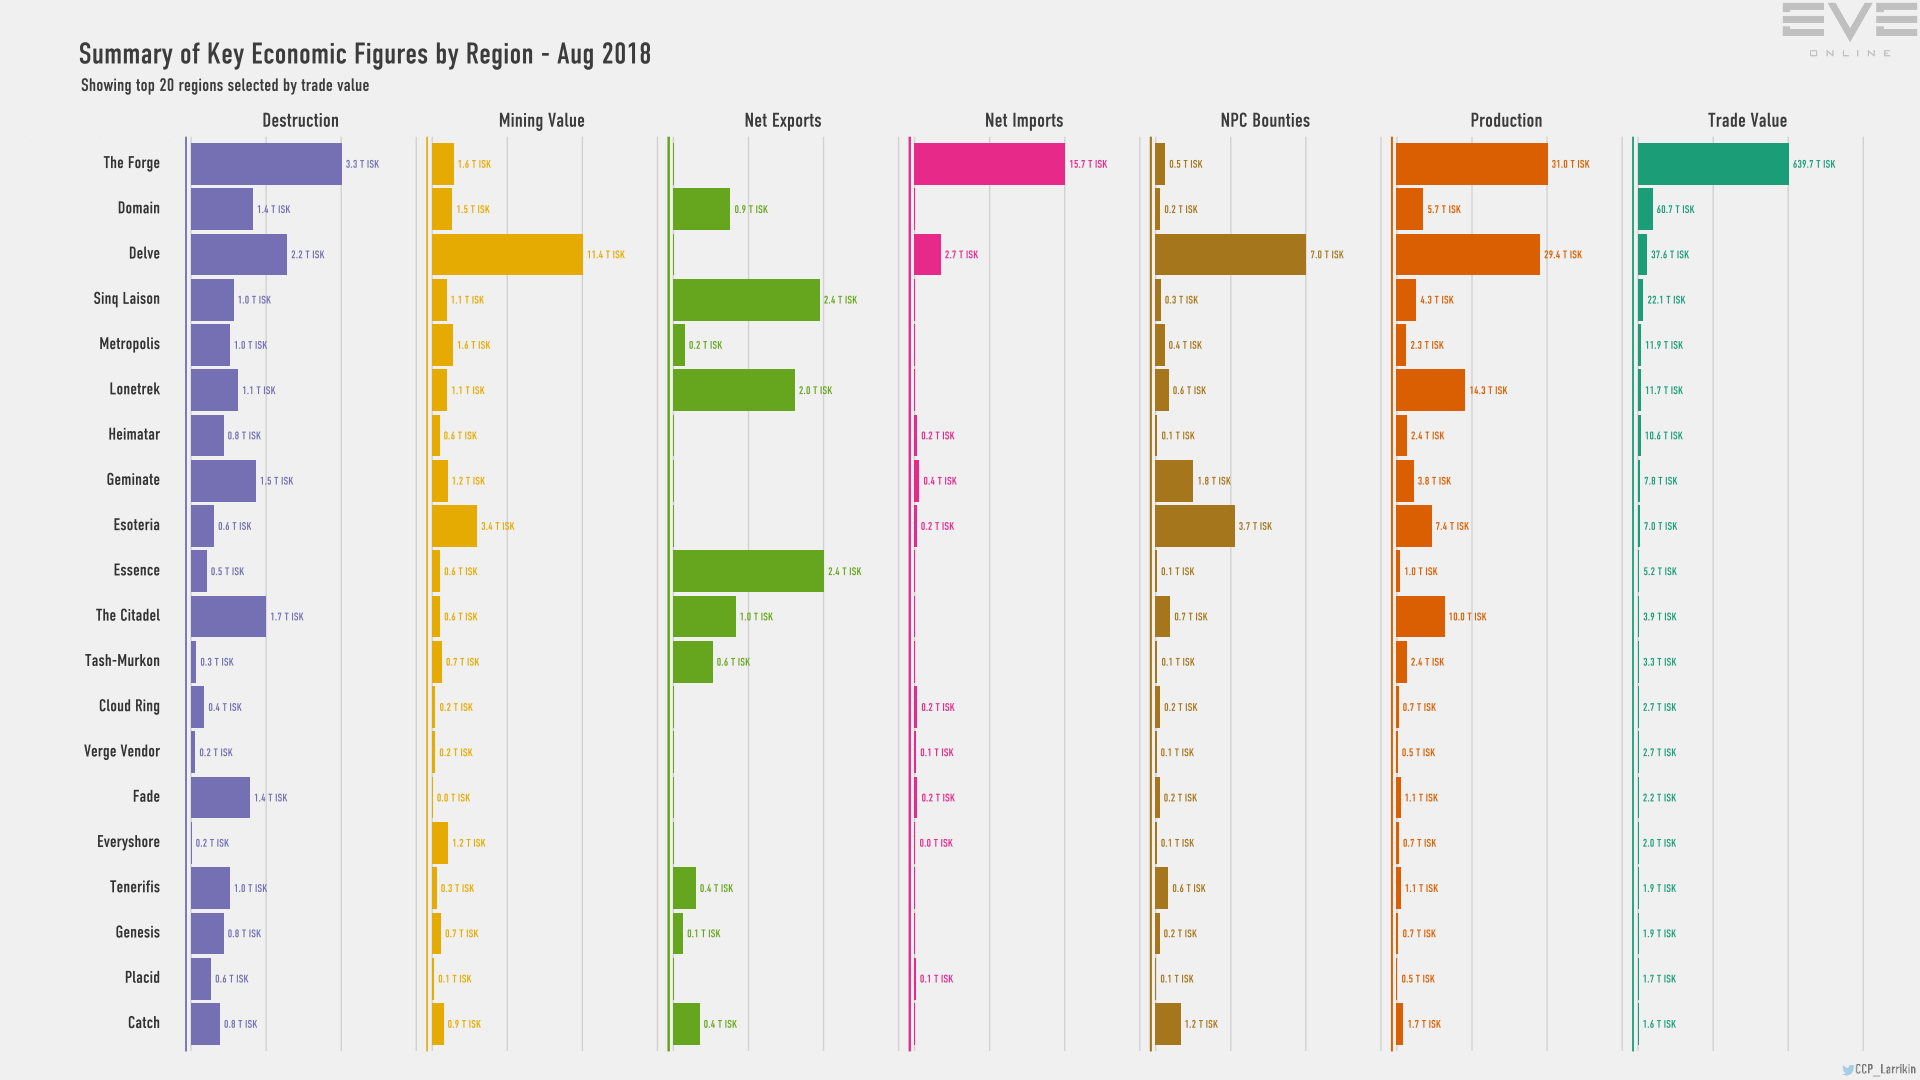
August 2018 – Trade Value by Region
However, trade value in The Forge, home of Jita, the economic hub of New Eden, was down in August, dropping 42 trillion ISK compared to the July numbers. That puts it on par with the pre-war June numbers.
Other regions saw some changes, Delve was down as people deployed northward, but Cloud Ring was up, where the Imperium staging base is located.

August 2018 – Trade Value by Region – Bar Graph
Jita remains so dominant that they have to make a bar graph excluding it to show the rest of New Eden.

August 2018 – Trade Value by Region – Bar Graph, Forge Excluded
Domain, home of Amarr and the second largest trading hub, was also down for August.

August 2018 – Contracts Trade Value by Region – Bar Chart
The value of trade via contracts, the primary way alliances sell doctrine fit ships, was also down a bit when compared to August. The one region seeing a boost being Cloud Ring where Imperium doctrine ship sales and fuel contracts likely caused the change.
And then there is production.

August 2018 – Production Values by Region
Production was likewise flat in most regions, with Delve ringing in 29 trillion ISK in that department in August. That number, which makes it the leading region in New Eden, was ever so slightly down from July.
Where production was up was in The Forge, The Citadel, and Lonetrek, regions that feed the Jita market. While the number was up 6 trillion ISK in The Forge alone over July, it remains fairly close to the 33 trillion in ISK value that the region produced in June.
Overall there are some mixed signals about the war. Ore prices are up, but my assumption that this has been driven by a need to produce replacements for war losses doesn’t have much of a foundation. It could be simply from the drop in actual mining in key regions causing the price rise, or a combination of the two. After all, the ore value mined in Delve was 14 trillion ISK at a time when prices were at low ebb.
Finally, the last chart I like to look at every month is the compared regional stats.
August 2018 – Regional Stats
That gives an easy comparison between certain key regions.
In the north the war carries on. I expect that the peak destruction will move from Pure Blind to Fade when the September numbers are published. It will also be interesting to see how the other numbers change. Are things that would show replacements for losses, like production and trade value, lagging behind or are these things just not happening?
And while there will be a lot of destruction in Fade this month, it looks like the numbers will not reach the heights seen in August. The northern forces do not seem as keen to test their resolve or the server’s capacity by defending the two Keepstars in Fade with their supers. The armor timer for CO2’s Keepstar in DW-T2I saw no real defense, nor did the final timer that blew it up. We shall see how it goes with the likely timers for the Keepstar in DO6H-Q.
As usual, you can find all these charts and more, along with the raw data used to generate them, in the dev blog for the August Monthly Economic Report.
No comments:
Post a Comment