We have now arrived at the twelve year mark of the blog. In looking for a title, The Dozens sprang to mind one evening and I thought it was a theme I could run with. I would just replace the usual array of category titles with self-deprecating insults about the deficiencies of the blog. Things like, “Your blogging is so weak, you only get accidental traffic from Google” or “You ramble so much that when you post around the house you post all the way around the house.”
Only, you know, actually funny.
That was back in February or so. I created the placeholder post, scheduled it so I wouldn’t accidentally publish it, then went on to do almost nothing with it until about a week ago.
So here I am an all I have to show for that title is a stock photo of eggs.

Photo by Lukas on Pexels.com
WordPress.com has access to a library of free stock photos and that is literally the best I could come up with for the word “dozen.” And I am not even sure what that green braided cord is. Some sort of vegan whip maybe?
Seriously, this sort of post looms over me at times, in part because I’ve done a credible job on occasion with this anniversary thing. I mean, go back and look at years five or six. (Cue linking to past efforts!)
- A Year of Living Noobishly
- Two Years Below the Masthead
- Three Years We Grew in Virtual Sun and Shower
- Four Years In, No Further From Noobdom
- Heroic Results of the First Five Year Plan
- But Now I am Six, I’m as Clever as Clever
- The Seven Year Kvetch
- Eight Years of Link Rot
- Nine is a Magic Number
- A Decade Under the Influence of Online Games
- Elf
Year six was pretty cute. But where I am I lately? Elf? Is that all I’ve got? And now a stock photo of a dozen eggs? And WP.com didn’t even pop my anniversary achievement in time for this post, so I had to mock up my own.

Pretty much indistinguishable from the real thing
Anyway, I am as half-assed in this as I am in so many things, so maybe I should just move on to some numbers. Numbers are good. I can hide in numbers.
Base Statistics
Days since launch: 4,383 (+365)
Posts total: 4,794 (+378)
Total Words: 3,537,779 (not including this post)
Average words per post: 738.11
Post Likes: 6,765
Average posts per day: 1.093 (-0.04)
Comments: 30,781 (+1,366)
Average comments per post: 6.42 (-0.24)
Average comments per day: 7.01 (-0.31)
Spam comments: 1,449,941 (+73,796)
Comments Rescued from the Spam Filter: 434 (+10)
Average spam comments per day: 330.8 (-11.7)
Comment signal to noise ratio: 1 to 47.2 (+2)
Comments written by me: 4,198 or 13.7% (+0.6%)
Images uploaded: 13,143 (+1,379)
Space used by images: 603.7MB of my 3 GB allocation (20%, up 11%)
Blog Followers: 1,491 (+151)
Twitter Followers: 730 (+8)
Tumblr Followers: 26 (+4)
US Presidents since launch: 3
British Monarchs since launch: 1
Prime Ministers of Italy since launch: 7 (+1)
I have at least kept up with my goal of posting every weekday… and then some. I am actually up 24 posts over last year which puts me over the one a day mark again.
Comments were down quite sharply in the first half of the year. The inertia of past years and a rather active August kept the average up, but the comments per post from January to June dropped in half over the previous years. I suspect that I didn’t write much controversial or stunning during that period, but it was still a pretty sharp fall off.
Anyway, those are the basic stats. After the cut there are a lot more bits of data about the blog, some you may have seen in past years along with a few new items this year.
And here we go.
Demographics
As I have said in the past, I thought this might be interesting to look at over time, but the results barely change at all year over year. The US dominates the numbers every time.
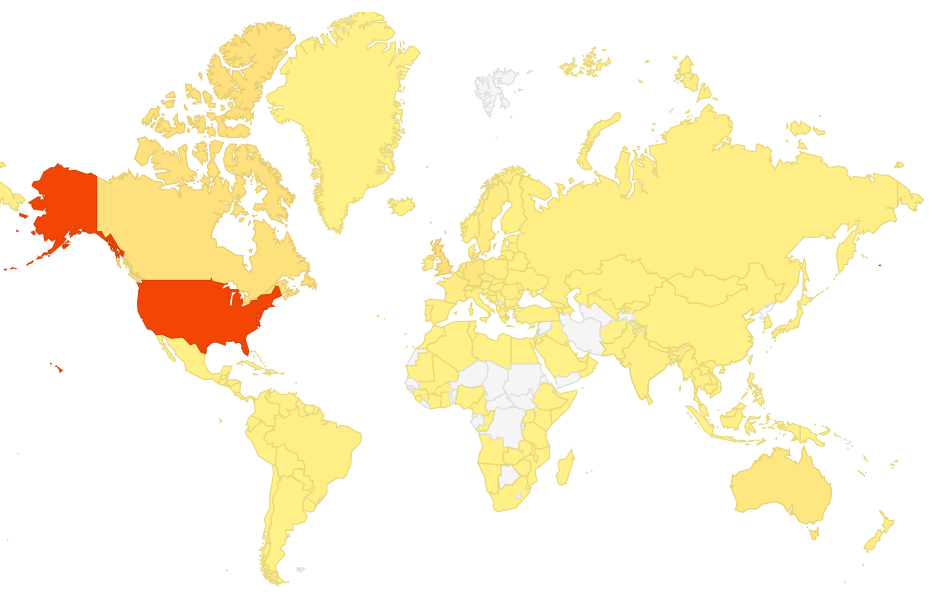
The same map every year Pinky
The top five remain the same, those being populous developed nations with a significant number of English speaking citizens.
- United States
- United Kingdom
- Canada
- Germany
- Australia
In the top ten France and the Netherlands jockey for position, but you have to get down to about 20 to see things change much, and then the numbers get so small that it is tough to care.

Flag Counter Percentages
At the other end of things, according to Flag Counter I have never had a visitor from the following places:
- Chad
- Christmas Island
- Comoros
- Nauru
- Niue
- Norfolk Island
- Palau
- Saint Helena
- Sao Tome and Principe
- South Sudan
- Svalbard
- Tokelau
- Tonga
- Tuvalu
- Wallis and Futuna
Not surprising I suppose. But not terribly interesting anymore.
So I thought I would look at some different data about people who visit the blog. To do so I signed up (and paid for) an upgrade to Flag Counter Pro. Flag Counter is that little thing down in my side bar that tries to track information about people who visit the site. I’ve had it there for nine years now, so I also figured it might be nice to throw them some money after all this time using their product.
It’s methodology is somewhat simplistic as it just counts based on how often that side bar thing gets loaded. That differs from how WordPress.com counts. For example, WP.com doesn’t count my traffic when I am logged in while Flag Counter does.
Still, it is some data collected in a consistent manner over time, so has some value if read knowing the limitations. By going pro it is now collecting more data about who visits the site. It isn’t pegged to IP addresses or anything, it is just the standard stuff that any web site gets when a browser hits it.
One thing I can now see is visitors from the US broken out by state. Unsurprisingly, that ranking closely mirrors the populations of the states, with California at the top and Wyoming at the bottom. Go figure.
Canadian provinces are a little off, with Ontario at the top by a long shot despite being in second place in population. But the most populous province is Quebec where speaking English is frowned upon, so no mystery why it is in first. Nunavut is, of course, last. I’ve only had 19 visits from there.
One of the things that got unlocked was the information about which browser and operating system visitors use. That information gets pulled by every site you visit. The browser data surprised me a bit.
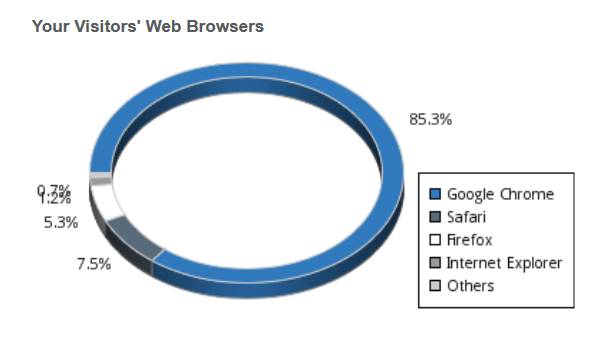
2018 User Browser Data
I was not aware that Chrome was that popular. Then again, I live in a world where data center agents are forced to use Internet Explorer, so most of my job is dealing with issues with that. While no unique identifying information is shown by Flag Counter, I can see myself hitting the site in their figures as I am the repeat visitor from California using Firefox.

What I see at Flag Counter… also click on the image to see full size
Operating systems are similarly stratified.

2018 Visitor Operating Systems
Again, I am surprised how many people have gone with Windows 10, though I am frankly more surprised at the number of people still hanging on to Windows 8 in some form.
Anyway, I thought that would make for a bit more interesting look into demographics. Currently the data set isn’t that big. The browser and OS numbers uses the last 250,000 visitors, which is (and hopefully will remain) less than a year’s worth of traffic, so that will be fresh and likely more accurate data to look into again for year thirteen.
Incoming!
Time to look at the sources of traffic to the site. As I started doing last year, I am going to break this out into two categories. This time it will be bloggers and blogger sites for the first and commercial and social media sites for the second, while search engines will go elsewhere. There is a reason for this, but I’ll get to that in a bit.
First, bloggers and blogger sites over the last year.
- totaleve.com
- evebloggers.com
- lowseclifestyle.com
- bhagpuss.blogspot.com
- blessingofkings.blogspot.com
- nosygamer.blogspot.com
- greedygoblin.blogspot.com
- raphkoster.com
- jestertrek.blogspot.com
- nilsmmoblog.blogspot.com
Total EVE and EVE Bloggers are both community aggregation sites for EVE Online and they seem to get a decent amount of traffic. After that we’re into the usual suspects, with an exception.
Raph Koster’s blog figures there entirely due to the “how much should a video game cost?” discussion that came up late last year. A lot of people read that and clicked on the link to me he had in his post.
Nils MMO Blog and Jester’s Trek show the power of the Blogger side bar. Neither blog has been updated in ages, but some people still use those blogroll every day. In the same vein, Gevlon’s old blog keeps on delivering while his new WordPress.com blogroll is static and uninteresting.
Then the same category, but over the life of the blog.
- virginworlds.com
- blessingofkings.blogspot.com
- evenews24.com
- lowseclifestyle.com
- evebloggers.com
- totaleve.com
- keenandgraev.com
- syncaine.com
- jestertrek.blogspot.com
- popehat.com
Despite the fact that my posts no longer appear over at VirginWorld, its long time role as the core of our blogging neighborhood keeps it at the top of the list, though Rohan’s Blessing of Kings is within striking distance of it and will likely pass it over the next twelve months, barring any changes to the status quo.
EN24 remains on the list from the short era during which my posts were syndicated on the site, while EVE Bloggers and Total EVE continue to climb up the list.
Now for commercial site. Over the last year the following sites have sent me the most traffic.
- tagn-wordpress-com.cdn.ampproject.org
- WordPress.com Reader
- pcgamer.com
- WordPress Android App
- forums-archive.eveonline.com
- forums.eveonline.com
- spoutly.com/session.php
I broke these out because they are somewhat interesting. Reddit ebbs and flows. I don’t get mentioned there very often, but when I do it does bring traffic.
The AMP Project though… I am not really sure how I end up with traffic from that. My blog posts have AMP compatibility enabled though, so there we go.
I mentioned during Blaugust how far along the WP.com Reader has come, and the stats reflect it. Twitter is a slow drip, but regular, while Facebook will pretty much disappear from the list due to changes there to prevent “fake news.”
PC Gamer is there because Steven Messner was nice enough to credit me with an image he used in an EVE Online article of his. I was actually able to thank him for that last year at EVE Vegas.
The EVE Online forums are interesting. Traffic from the form archive is made up entirely of hits on my post about the demise of Battle Clinic, while the current forum traffic was from the old This Week in EVE posts that used a few of my images with credit.
Commercial sites over the life of the blog shake out like this.
- WordPress.com Reader
- Google Reader
- feedly.com
- massively.joystiq.com
- Netvibes
- WordPress Dashboard
- massiveblips.dailyradar.com
The WordPress.com Reader has improved enough to pass Google Reader, which has been gone more than five years now. Its replacement, Google+, comes in at 15th so doesn’t make the cut here.
Feedly isn’t as popular, though people don’t always click through because I publish full posts to my feed. And then there is Massive Blips, which used to be a decent traffic source for a while.
One of my favorite entries that didn’t make the list is from Stack Exchange, where I got a bit of traffic due to a post being linked in a thread about voxels.
And that is where most of my non-search engine traffic comes from.
Search Engines
I actually have more, and more detailed, information about search engines this year. In part this is because during Blaugust I went and got the blog signed up with the tools for Google, Bing, and Yandex to see if that would make any difference in traffic. In a month, it has not, though it has given me a lot of data. But let’s start by ranking the traffic I get from search engines. For this I even have percentages.
Over the last year:
- Google Search 98.86498%
- Bing 0.32854%
- Yandex 0.27392%
- Yahoo Search 208 0.16708%
- Google Image Search 0.11728%
- Ask.com 0.08675%
- duckduckgo.com 87 0.06988%
- myway.com 0.03534%
- Baidu 0.01205%
- att.net 0.00723%
- MSN 0.00643%
- earthlink.net 0.00562%
- Yahoo Image Search 0.00562%
- t-online.de 0.00562%
- ixquick.com 0.00321%
- live.com 0.00241%
- biglobe.ne.jp 0.00241%
- kvasir.no 0.00161%
- talktalk.co.uk 0.00161%
- AOL 0.00161%
These days Google, Bing, and Yandex are the top three, but frankly if you’re not Google you’re barely worth a mention. That is probably the only time AOL makes any lists these days. The actual number for AOL was two.
Over the life of the blog:
- Google Search 78.5733%
- Google Image Search 18.3100%
- Bing 1.2414%
- Yahoo Search 0.7000%
- Google Mobile 0.1545%
- Ask.com 0.1422%
- Yahoo Image Search 0.1165%
- isearch.avg.com 0.1046%
- wow.com 0.0986%
- Yandex 0.0937%
- search.babylon.com 0.0814%
- AOL 0.0570%
- Conduit.com Search 0.0555%
- search-results.com 0.0550%
- duckduckgo.com 0.0549%
- search.comcast.net 0.0414%
- mywebsearch.com 0.0226%
- live.com 0.0161%
- sweetim.com 0.0160%
- dogpile.com 0.0134%
Google is still king over the years, though that Google Image Search entry is a sore spot. Up into January 2013 the image search would bring you to the site host the image if you clicked on it. Now it just makes the image bigger and shows variations on it. That is where a lot of my traffic went and explains why 2012 was the peak year for the blog. Five years later that is still 18% of my total search engine traffic despite having dropped to the negligible “less than Yahoo” level of influence, so back then it was a much bigger slice of the pie.
Then again, search engine traffic is transitory. They make for page views, but do they stick around and become readers? Maybe a few do, but I would bet that 99% move on never to return.
Anyway, that is all fine and good, but what else do I have that warrants putting search engines in their own section? First, in having signed up for the webmaster stuff for the search engines I can confirm that Bing is shit in that regard as it is in most things. Having used Google and Bing side by side, I can’t imagine what Bing is thinking. Oh well.
Also, having signed up thinking I might end up with more traffic proved to be false. At least in the short term. The three having indexed my blog… well, Google and Yandex having done so while Bing is still thinking about it a month later… might lead to that, but for now there was no noticeable change at my end, despite Bing’s joyous news.
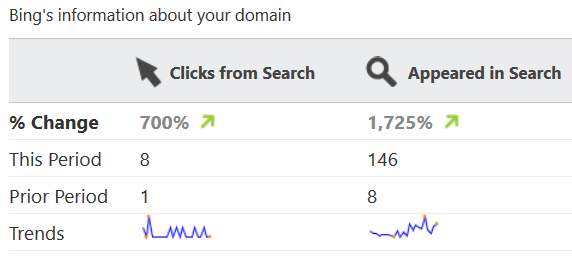
Bing reports a surge in traffic!
That, by the way, is actually a combination of Bing and Yahoo traffic. It all comes together these days. I get more traffic from Russia via Yandex.
What I did find, at least with the Google site, was access to data I had been missing. Google doesn’t pass on search terms to sites under most conditions anymore. They just come through as unknown. However, in the Google web tools you get to see all the search terms that get used multiple times. So I can again see what brings people to the blog. So, over the last month these have been the top search terms.
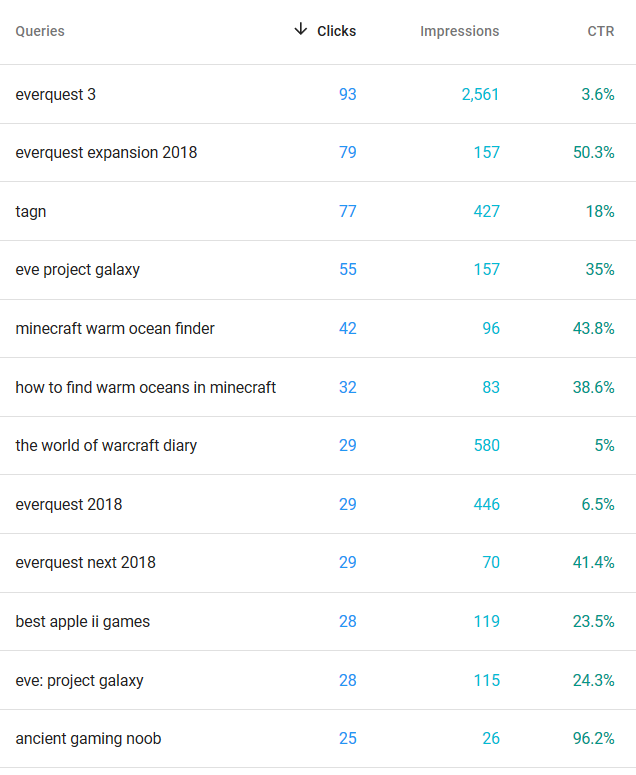
August 2018 search data – click to make bigger/readable
That is only for a month, but next year I will have a full 12 months of data.
Clicks are how often people actually clicked through and showed up here.
Impressions are how often the site showed up in a search on that term.
And CTR is the click through ratio, or how many clicks against impressions.
96.2% of people who search on “ancient gaming noob” click through and end up here. I do wonder about that other 3.8%.
There is another chart from Google that I want to share, and this is the one related to sites linking to the blog. I have sorted it by target pages linked.

Site Linking to Posts at TAGN
I find this data to be pretty funny.
Sure, the top entry on the list is no surprise. Again, while VirginWorlds hasn’t linked directly here in years now, a long history of linkage remains.
And WordPress.com probably isn’t surprising. The overall linking pages, ringing in at over 3 million, seems huge. I am not sure how that is calculated. But since I know that Google sifts through all of the tag and category pages that WP.com generates, it doesn’t seem impossible.
Blogspot.com though… you know, Blogger… could be all those magic blog rolls I guess. Either that or Bhagpuss links to me a lot more than I think he does.
After that though, the chart is made up entirely of sites that steal my content. This is why I recommend you link back to your old posts when writing on a related topic. Content stealing sites don’t seem keen on cleaning out links so you might as well enjoy some benefit, which in this case probably boosts my Page rank a bit. At least it might keep it from slipping below 4 in any case
Outgoing!
Now on to where I send traffic. Again, I will break this out between bloggers and commercial(-ish) sites, just because.
-Click Destinations over the Last Year – Bloggers
- nosygamer.blogspot.com
- bhagpuss.blogspot.com
- biobreak.wordpress.com
- syncaine.com
- greedygoblinblog.wordpress.com
- evepics.wordpress.com
- http://www.keenandgraev.com
- blessingofkings.blogspot.com
- endgameviable.com
- http://www.killtenrats.com
I link to Nosy Gamer a lot when it comes to EVE Online topics, and Bhagpuss when we are going on about Daybreak, so there is no surprise finding them at the top for the year. Otherwise the influence of my own hacked-together side bar blogroll and how often the sites in question post probably explains the list for the most part.
-Click Destinations over the Last Year – Commercial(-ish) Sites
- Wikipedia
- Battle.net
- Playhearthstone.com
- Worldofwarcraft.com
- zkillboard.com
- Imperium News
- Massivelyop.com
- community.eveonline.com (Dev Blogs and Patch Notes)
- Kickstarter
I think the April Fools post puts Blizzard out in front every year. I certainly don’t link to Hearthstone very much otherwise. I think five and below are related to things I post about a lot over the rest of the year, while Wikipedia is my main link out to explain topics I do not wish to diverge into. I ramble enough as it is.
-Click Destinations over the Life of the Blog – Bloggers
- syncaine.wordpress.com
- http://www.keenandgraev.com
- blessingofkings.blogspot.com
- evepics.wordpress.com
- http://www.killtenrats.com
- biobreak.wordpress.com
- bhagpuss.blogspot.com
- tobolds.blogspot.com
- jestertrek.blogspot.com
- playervsdeveloper.blogspot.com
Here we’re more beholding to how long and how prolific a given blogger has been. SynCaine and I have been going back and forth for years.
-Click Destinations over the Life of the Blog – Commercial(-ish) Sites
- WoW Guild Name Generator
- Pokemon.com
- Wikipedia
- Civfanatics.com
- Battle.net
- pokemongoldsilver.com
- myeve.eve-online.com
- Blizzard.com
- eve-online.com
- pokemonblackwhite.com
And then there is the weight of inertia as that Nick Yee WoW Guild Name Generator post has received more traffic (as noted in the next section) than any other post ever. Ah well, Nick has enough of a lead that it will be years before something else is at the top when it comes to outbound clicks.
Most Viewed Posts
Over the past year.
- From Alola Pokedex to National Pokedex in Pokemon Sun
- April Fools at Blizzard 2018 is Mostly Just World of Warcraft
- Alamo teechs u 2 play DURID!
- Where the Hell is that EverQuest Successor Already?
- Burn Jita Back for 2018
- Top 25 EVE Online Corporations Graph – The End Number
- Burn Jita 2018 Aftermath
- Rumors of Future Daybreak Projects and the End of EverQuest
- Extra Credits – Picking at the Lockbox Thing Some More
- Do You Wear the Mask or does the Mask Wear You?
- Rift Prime Time
- SuperData and the Rise of Fortnite
- At the Camp in 68FT-6
- The Road to CSM13
- Honest Game Trailers – Animal Crossing
It is interesting to see which posts get traction over time. Again, since such a large percentage of people visiting the site get here via Google, posts that Google favors bubble up the list. As I have noted in my last two month in review posts, certain articles seem to have become regular targets for search engine traffic.
Over All Time
- Play On: Guild Name Generator
- Running Civilization II on Windows 7 64-bit
- How To Find An Agent in EVE Online
- How to Catch Zorua and Zoroark
- First Pokemon Black and White Download Event – Victini
- Alamo teechs u 2 play DURID!
- April Fools at Blizzard – 2013
- Considering Star Wars Galaxies Emulation? Better Grab a Disk!
- Diablo III vs. Torchlight II – A Matter of Details
- From Alola Pokedex to National Pokedex in Pokemon Sun
- The Mighty Insta-90 Question – Which Class to Boost?
- EVE Online – The Tutorial
- Getting Upper Blackrock Spire Access
- World of Warcraft Magazine – Issue 2
- Type 59 Being Pulled from the World of Tanks Store
The weight of time favors older posts over newer ones here. Some of these are really old and get no traffic these days, but were popular enough for a while to secure a spot on the list. The most recent post on this list is number 10. Posted in March of 2017 it has been a search engine favorite.
Categories and Tags
Categories are the stable staple of the blog filing system here at TAGN, at least one being assigned to every post. Leaving out the generic “entertainment” category, a legacy of the early days of WP.com, there are 94 categories on the site. That is up four from last year, which is a pretty radical change for me. “Fantasy Movie League” and “WoW Classic” were added, while “Steam” was moved from being a tag to a category.
The top twenty most used are:
- EVE Online – 1,383
- World of Warcraft – 1,137
- EverQuest II – 660
- EverQuest – 523
- Lord of the Rings Online – 377
- Blizzard – 338
- Sony Online Entertainment – 336
- Instance Group – 274
- Humor – 234
- Pokemon – 211
- Misc MMOs – 189
- blog thing – 178
- Rift – 158
- Month in Review – 144
- Nintendo DS Hardware – 139
- Vanguard SOH – 134
- YouTube – 134
- Other PC Games – 131
- Diablo III – 128
- Minecraft – 107
While categories are not mutually exclusive… I can write about WoW and EVE in the same post… that does give a pretty good hint as to what I write about most.
The least used categories are:
- Elite: Dangerous (2)
- Neverwinter Nights 2 (4)
- World of Warships (7)
- WoW Classic (7)
- Random (8)
- RPGs (9)
- memes (9)
- Path of Exile (9)
- Gaming Industry Trends (10)
- Neverwinter (11)
Clearly there are a few games I thought I would play, or at least post about, more than I did. I expect the “WoW Classic” category to get used a lot more in the future. A couple are kind of vague I suppose, like “Gaming Industry Trends” and “RPGs.” And “memes” doesn’t mean what you think it does. A decade back a blog meme was a topic where you tagged a few other people to do it after you responded. That has fallen out of favor as blogging has.
Tags are the more whimsical part of the system here, being subject to immediate mood or fancy. They fill in for games that don’t rate a category, details like zones or solar systems or expansions, or sometimes just my general feelings about a post or warnings to the reader. There are 3,393 tags used over the last 12 years, up 189 from last year. I continue to make up a new tag for a lot of posts it seems.
The top twenty tags I have used are:
- CCP (119)
- Progression Server (109)
- Fippy Darkpaw (83)
- Nostalgia (77)
- Reavers (75)
- Asher Elias (74)
- Meaningless Milestones (70)
- Warlords of Draenor (63)
- Free-To-Play (62)
- MMO Expansions (59)
- Pokemon Go (54)
- RMT (45)
- Casino War (44)
- Cataclysm (43)
- Delve (42)
- WoW Legion (42)
- Contest (41)
- Pokemon SoulSilver (39)
- Pokemon Diamond (38)
- StarCraft II (38)
I think there are probably a few more tags that should become categories. I write about CCP and Progression Servers more than Minecraft it seems. “Nostalgia” is probably an under used tag on the list.
There isn’t much point in trying to list the least used tags since there are a bunch that I have used but once. But here is a list of odd one time tags:
- i can haz sarnak burger?
- Michael Jackson
- Michael Nesmith
- a softer world
- Meridian Quad
- Wally Cox
- stuff that costs a lot of ISK
- Anivilmar Hammer of the Beast
- Fjord Penguins
- EVE Quirks
- Tom Joad
- Adam Curry
- Orthicon Tube
- Radio Detection Finder
- Emporia State University
- Large Hadron Collider
- Strange references that seemed like a good idea but then go awry
- The withering constraints of society
- Tales from the Parental Basement
- Dutch War of Independence
A Peek Into Page Views
Here are the numbers, the page views the blog has received over the last dozen years, broken out by months and years.
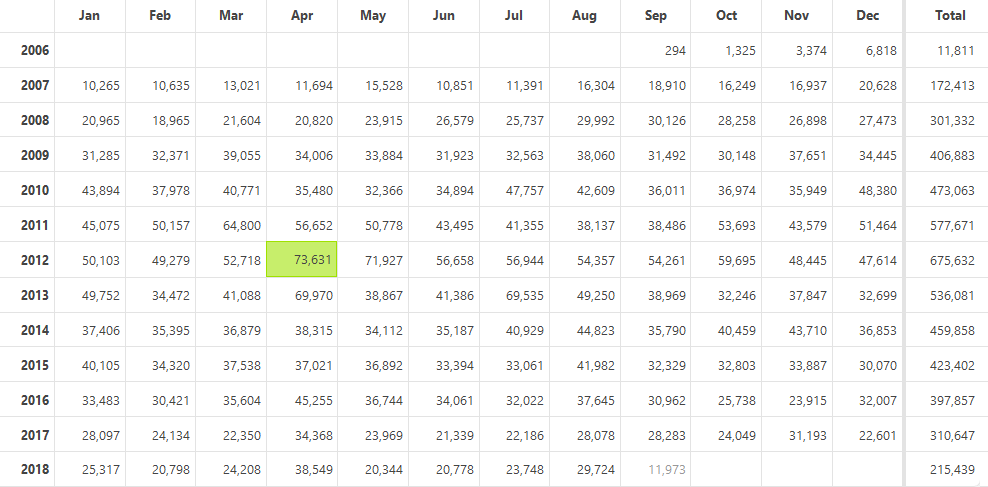
Total Page Views by Month/Year
And, if you want, the average daily page views.
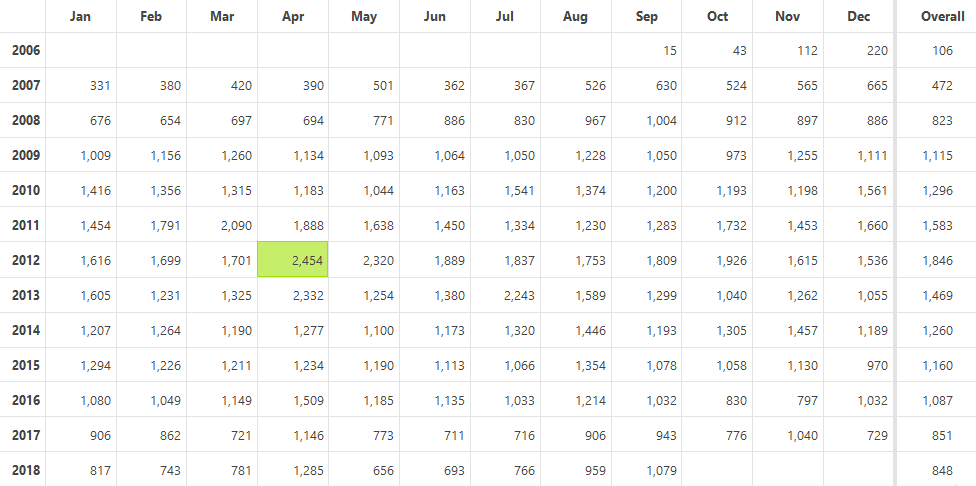
Average Daily Page Views by Month/Year
You can see that the site remains in decline on this front, with 2018 threatening to have fewer page views than 2008, though with the uptick from Blaugust that seems to have held over into September, maybe the site can at least match 2008.
As noted above, you can see the decline in page views between January and February 2013, when Google changed how image search worked.
So Many Words
This is a new section that reflects a new feature added by WP.com. The stats page has an Insights section which has some bits and pieces of data. But last year they added the feature I was waiting for; word count.
At the ten year mark I was trying to estimate how many words I had posted over the life of the blog, but had no real basis on which to ground such a thing. Well, I could have opened up every single post and written down the word count, then added them up, but I wasn’t THAT interested in knowing the answer. So I called is somewhere between 250 and 500 words per post. As it turns out I was low in that estimate. 738 was closer to the mark. Anyway, this new chart will let you see all.
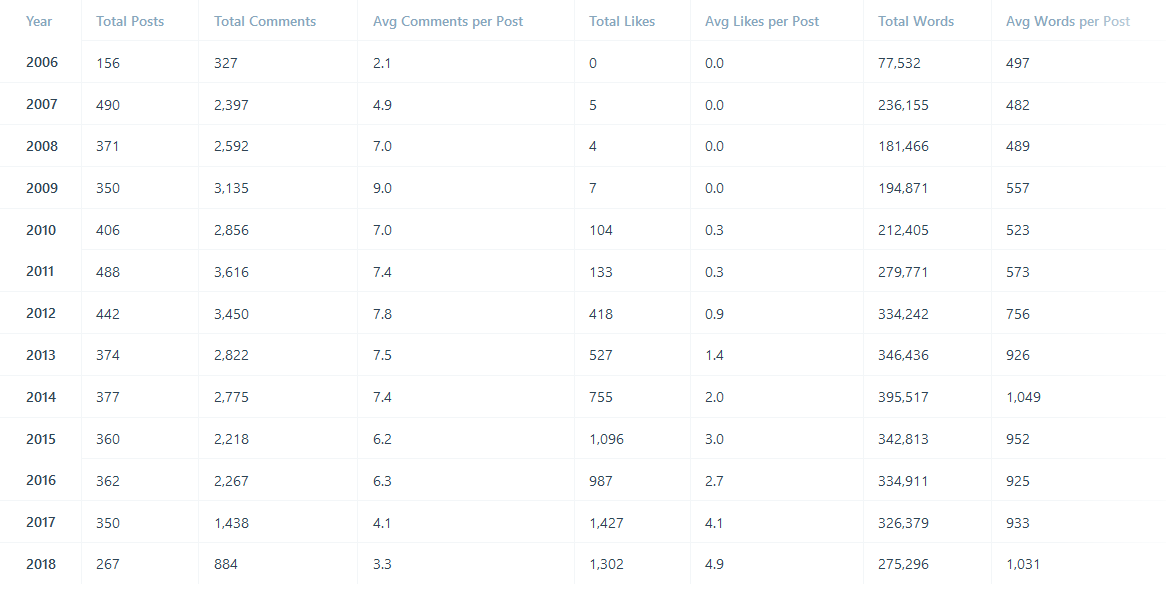
September 2018 – Word count, like, and comment numbers – Click on it to make it bigger/readable
I am so in love with this data. This is reason enough to favor WP.com over Blogger, at least for the numbers and stats part of my brain.
I have, of course, taken that chart and put it in a spreadsheet so I can get even more data out of it, such as the total number of words posted. (The chart does not include this post which already looks like it might be edging past 5,000 words.)
As you can see, my posts have become fewer but longer over time. I started out with close to 500 words per post, which is still kind of a lot, and moved on to being close to a thousand words with each post. There is one aspect of the blog that is not in decline; wordiness. But why the surge in verbosity over time?
I suspect I know the reason… or reasons.
First of all, my month in review posts make me go back and look at old posts. I started figuring out what I needed to include with posts to make them worth reading a year, five years, and ten years later. More narrative and description and context started to figure into posts.
Second, some regular posts, such as the month in review, started growing in size. My first month in review post back in September of 2006 was just over 500 words. The one for this past August was close to 2,500 words. All that looking back to past years has grown over time.
Third, I quote things wholesale these days. Daybreak puts out a press release on their site or a farewell note in the forums and I quote the whole damn thing. I’ve gone wanting for such documents at times, having simply linked to them only to find the company has attempted to memory hole them, as Daybreak did earlier this year when it suddenly decided it had never been owned by Eurasia. Now I have everything Daybreak or whoever said on the site in a post I can find. That will inflate the word count for a post.
Finally, I think in the “play vs. blog” balance, I have started to slide over to the blogging side more and more over the years. Weeks where I spend more time writing than playing video games are more and more common.
Probably the most concerning question brought up by that chart is what has happened to comments. For a seven year stretch the comments per post average was above seven. Then it dropped to around six for two years, then under five last year, and now it is barely three comments per post on average. What has happened?
Well, as we saw in the previous section, page views are down. Less people showing up means less people to comment. But with page views trending to 2008 levels, comments are way down from even there. So I do wonder where the comments have gone. Have I finally offended enough people to have an impact? Have may post gotten either more intelligent or more idiotic to the point that people don’t feel the need to comment? Am I just writing about dull topics?
I think the latter might enter into it. I don’t play or write about new games much anymore. I am well off the trends, hanging out with WoW, EVE, and Minecraft a lot of the time. If I were smart I would cater to search traffic… well, if I were looking for a way to boost comments. But while I like comments, more so than page views, it is tough to get myself to write about anything that I am not already set to do.
Still, I can take comfort in the fact that my likes per post have been trending up!
Internal Questions I Still Have over a Dozen Years Later
When I do a month in review post, should I use categories and tags for the games I discuss? I feel like I inflate category usage by doing that. But then again I do occasionally say something important… and not otherwise covered by a blog post that month… about the games I mentions.
Should month in review be on the last day of the month or the first day of the next month? I have chosen to keep it on the last day of the month so it is categorized with the rest of the month in the archives. Also, almost nothing I reference has any chance of changing between when I post and at the end of the actual day.
Should I stick with UTC as the time zone setting for the site? Back when I started the blog you were stuck with UTC. Later you could set your site to be on your own time zone. UTC doesn’t bother me, but it does mean my stats are offset by 8 hours. Would changing the time zone screw up my historical stats?
Where did those 23,134 page views go? When I add up all the page views in the tables below in the next section I get one number, but WP.com totals them up elsewhere as another number that happens to be 23,134 page views less. That is like a month from 2008… or 2018… gone missing.
If I italicize game and expansion names, should I also italicize the names of other blogs if I refer to them?
And why do I seem to start so many new paragraphs off with a conjunction?
Is it better to put a page break in a long post so it doesn’t take over the whole front page of the blog, or am I fine without a page break and letting all of the text just spill out in front of everybody?
Is it super capital or supercapital? Super carrier or supercarrier? Super-carrier? Blogroll or blog roll?
How many commas is too many? Should I just break this single, paragraph-long sentence into three or four more manageable sentences?
Has the ship pretty much sailed when it comes to the benefits of getting a custom URL? I worry if I get one I will lose traffic and then if I give it up later I will lose whatever traffic adapted to the first change.
Have I really not be able to come up with a better blog name to go with the “TAGN” acronym?
Would it really be so bad to take a week off once in a while?
The Inevitable Forward Looking Statement
Is there a point to this section anymore? I mean, besides padding this post past five thousand words mark.
I have a long established habit of claiming that, evidence to the contrary, this time I am going to actually write fewer blog posts and play more video games in exchange. I mean, I suppose I did see a dip in posts last year, but then I made it back up this year. But I am a bit afraid of that last question in the section above. If I took a week off… and I mean a real week off, not like in June when I went on a seven day cruise and still had five posts that week because I wrote them all in advance… I’m half afraid I would never come back. Part of what keeps me going at this is the fact that I haven’t stopped.
It seems more likely that, barring some major life change, the status quo will remain here at TAGN. There are days when I don’t feel like writing, but I always seem to love having written.
So thank you for stopping by now and again, and doubly so if you made it all the way down to the end here without skipping too much of the above. There will, as like as not, be another post tomorrow on some topic related to one video game or another. EVE Online seems the probable front runner.
Also, with that I have to think about a theme for the 13th anniversary. That number is considered unlucky by some, but it is practically the talisman of our family.
Has your appetite for pointless information been sated?
No comments:
Post a Comment