CCP has apparently caught up with all the extra work from doing both EVE Vegas and the Onslaught expansion in about a month’s time, so the team has returned to some of the smaller items on its usual list, like the Monthly Economic Report.
Actually, we got two. I had been bitching about how they skipped September. But when I saw the October report appear in my feed I went to the dev blog site and found the September one there as well, dated “October 3, 2018.”
That agitated me a bit, because I had been checking for the September report for ages. How could I have possibly missed it? But an update from CCP Falcon announcing that both reports had been released on the same day.
Somebody fiddled the dates on the Dev Blog site. I wonder how much they were paid for that? Damn those corrupt developers!
I was going to simply skip over the September MER because I am sure nobody is exactly pining for me to put up two MER posts in a single month. But it turns out the October MER is currently messed up. The charts are missing two regions, Fade and Cache, and there is at least one chart from August posted.
I’m still leafing through the Onslaught patch notes, in case I missed something about CCP removing two regions from the game, since I am not certain anybody would notice if either went missing. But the chart from August is a key one I use each time, so I am going to postpone writing about October until that gets fixed, which might mean skipping October altogether. We shall see.
Back to September, we’ll just jump right in where we usually do, which is with the mining numbers.

September 2018 – Mining Value by Region
In a turn likely to surprise nobody who has been paying attention, Delve both led the pack in September and was up by almost 5 trillion ISK in mining value. Since peace broke out in null sec in the back half of the month, pilots returned to Delve and resumed their strip mining of space.
We also got the bar chart back for September, so you can see how the various regions ranked.

September 2018 – Mining Value by Region Bar Chart
The highest region in the north appears to be Branch, with the east of null sec more closely trailing Delve, though Querious, owned and mined by the Imperium, is in third place overall.
A 5 trillion ISK jump in mining in Delve doesn’t seem like a huge uptick given the coming of peace. And, while peace came late in the month, so maybe October will show a greater increase, the September jump is also fighting a drop in mineral prices.

September 2018 – Economic Indices
Mineral prices dropped to a three year low in September, and since mining is measured by the value of the ore mined, if the price goes down then the ore value goes down even if exactly the same amount of ore is mined.
Mineral prices are not yet at an all time low, as the next chart shows.

September 2018 – Economic Indices over All Time
There was a long stretch between 2007 and 2012 when mineral prices were lower. But since the rework or NPC drops in the Drone Regions the price has been consistently higher.
Moving on to NPC bounties… well, what did you expect?
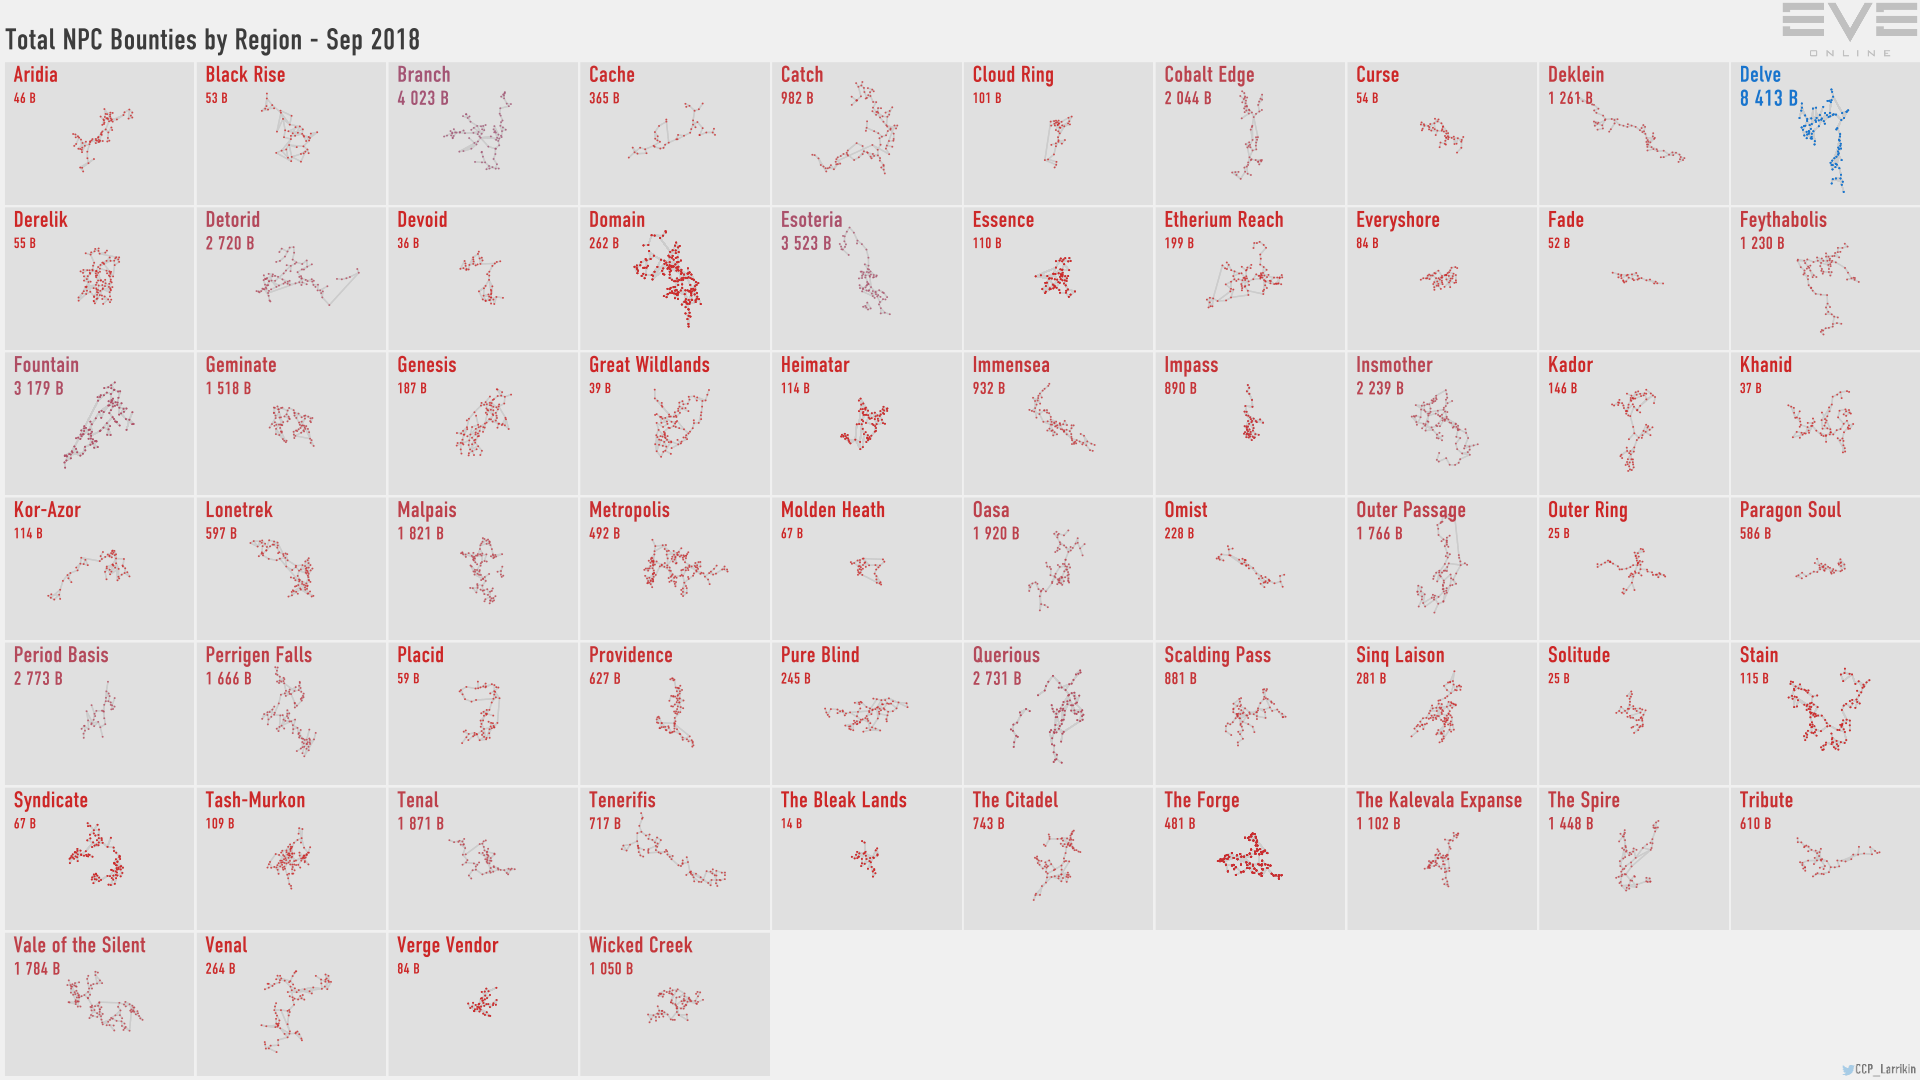
September 2018 – NPC Bounties by Region
Delve led the pack yet again, though was “only” up by about 1.4 trillion ISK over August. Again we have the bar graph back so we can see how the regions shook out.
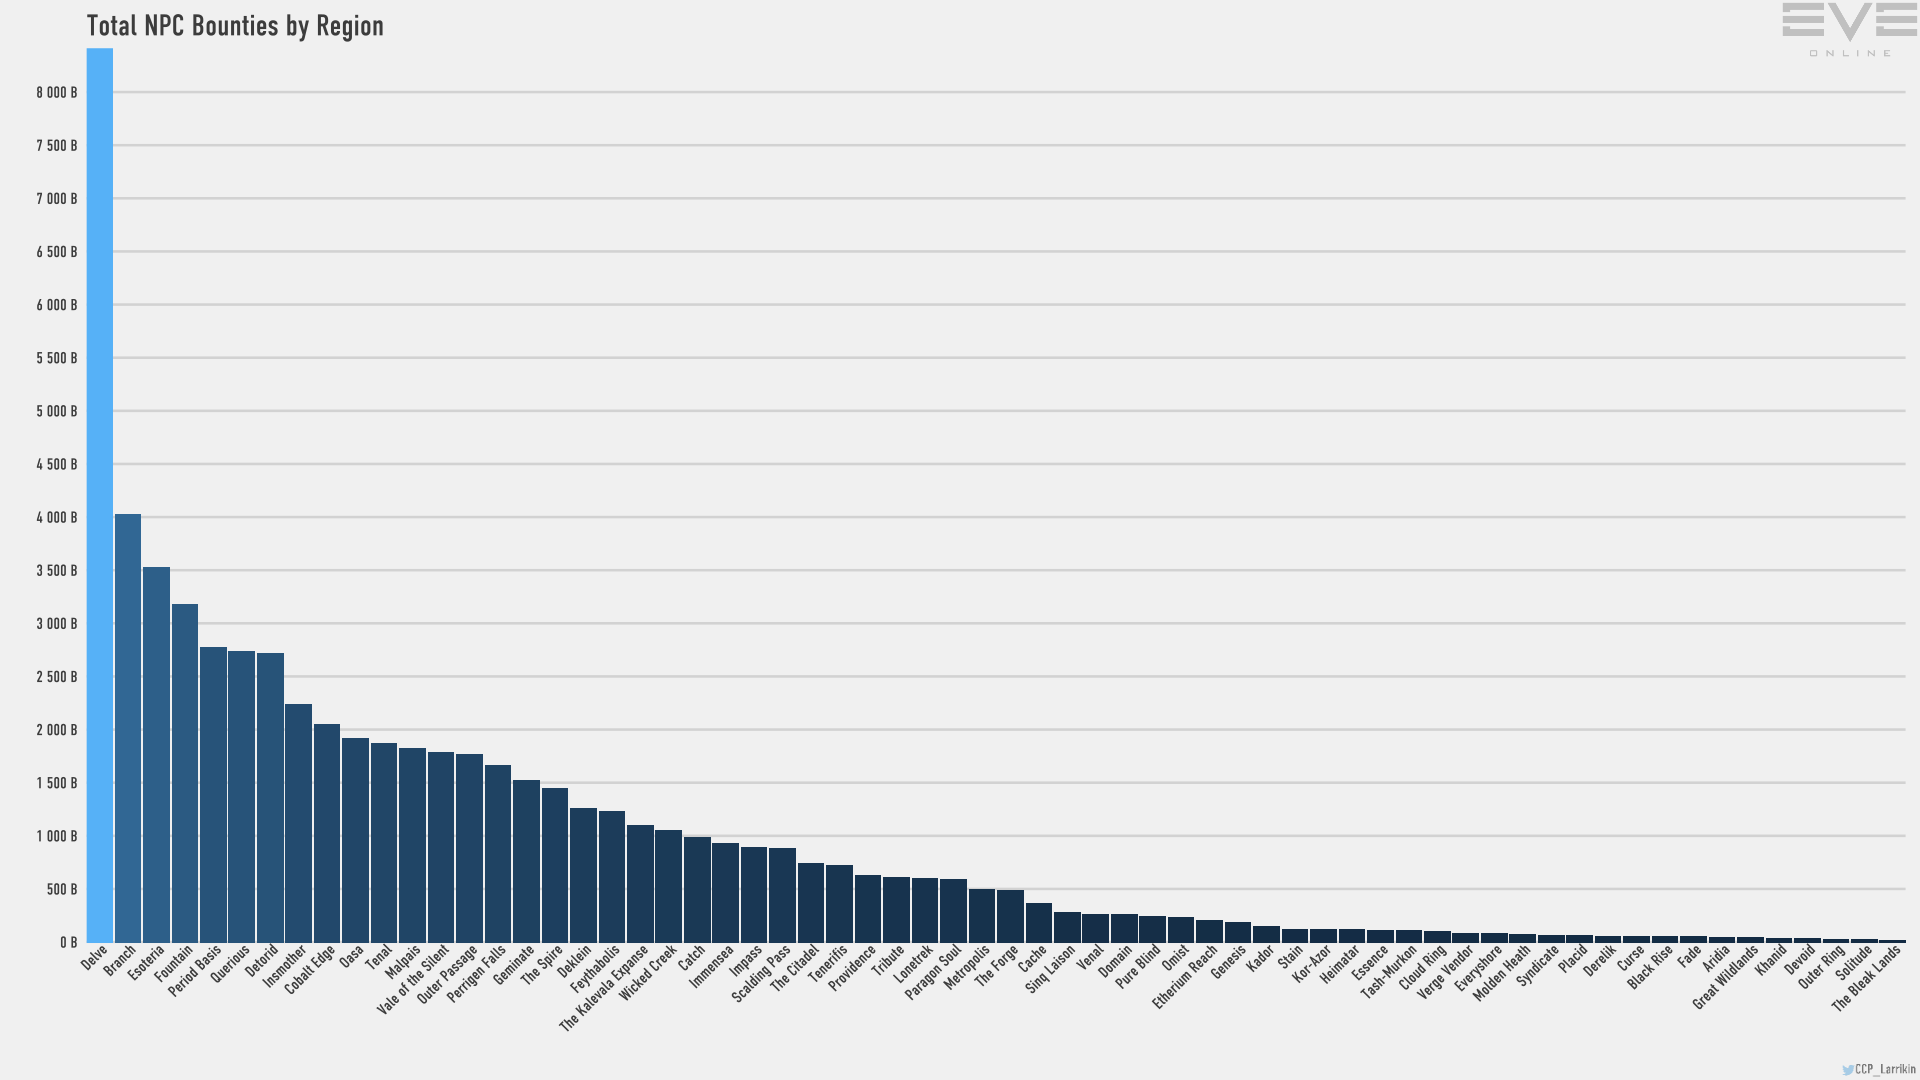
September 2018 – NPC Bounties by Region – Bar Graph
Branch, where GotG retreated, saw a significant amount of bounty payouts as well.
Overall null sec bounties were a slightly smaller percentage of the overall pic.

September 2018 – NPC Bounties by Sec Status
Yes, null sec still totally dominates, but the percentage was 93.2%, down from 93.4%, with high sec seeming to pick up most of that. It is a tiny change, but when you consider that the war was ending you might figure that number would go up for null sec. And doubly so as we see NPC bounties reaching for an all time high again, as the next chart shows.

September 2018 – Top Sinks and Faucets
Bounties haven’t topped past records, but my guess is that the October version of this chart won’t show a downturn.
Then there is the trade front.

September 2018 – Trade Value by Region
As usual, the region containing the central trade hub of New Eden dominates the numbers. Jita stands so tall that everybody else appears to be… I was going to say a dwarf, but maybe a dwarf embryo might better describe the ratio.

September 2018 – Trade Value by Region – Bar Graph
Removing The Forge from the graph better shows how the rest of the game universe compares.

September 2018 – Trade Value by Region – Bar Graph, Forge Excluded
With that we see Domain, home of Amarr, standing out with its second place numbers, followed by Delve, home of the Imperium, the economic empire of null sec.
Overall trade is down a lot, with The Forge seeing a drop of nearly 90 trillion ISK compared to August. While there is still a lot of trade going on, the war boom seems to be over. Additionally, looking at prices, the market also appears to have back filled demand for Abyssal Deadspace relates items, like Gilas, causing prices to ease up some on that front.
Cloud Ring, where the Imperium was based for the war, saw a full trillion knocked off of its trade value compared to August, bringing the number down below 1.6 trillion. Expect that to fall off further come the October report.
The same goes for contracts, where Cloud Ring fell off in September for the same reason.

September 2018 – Contracts Trade Value by Region – Bar Chart
Again, The Forge led the way with contracts, but Delve isn’t all that far behind.
And then there is Production. The war saw some destruction, though not as much as one might have wished. Still, there were ships to be replaced and everybody needs to build up for the next war.
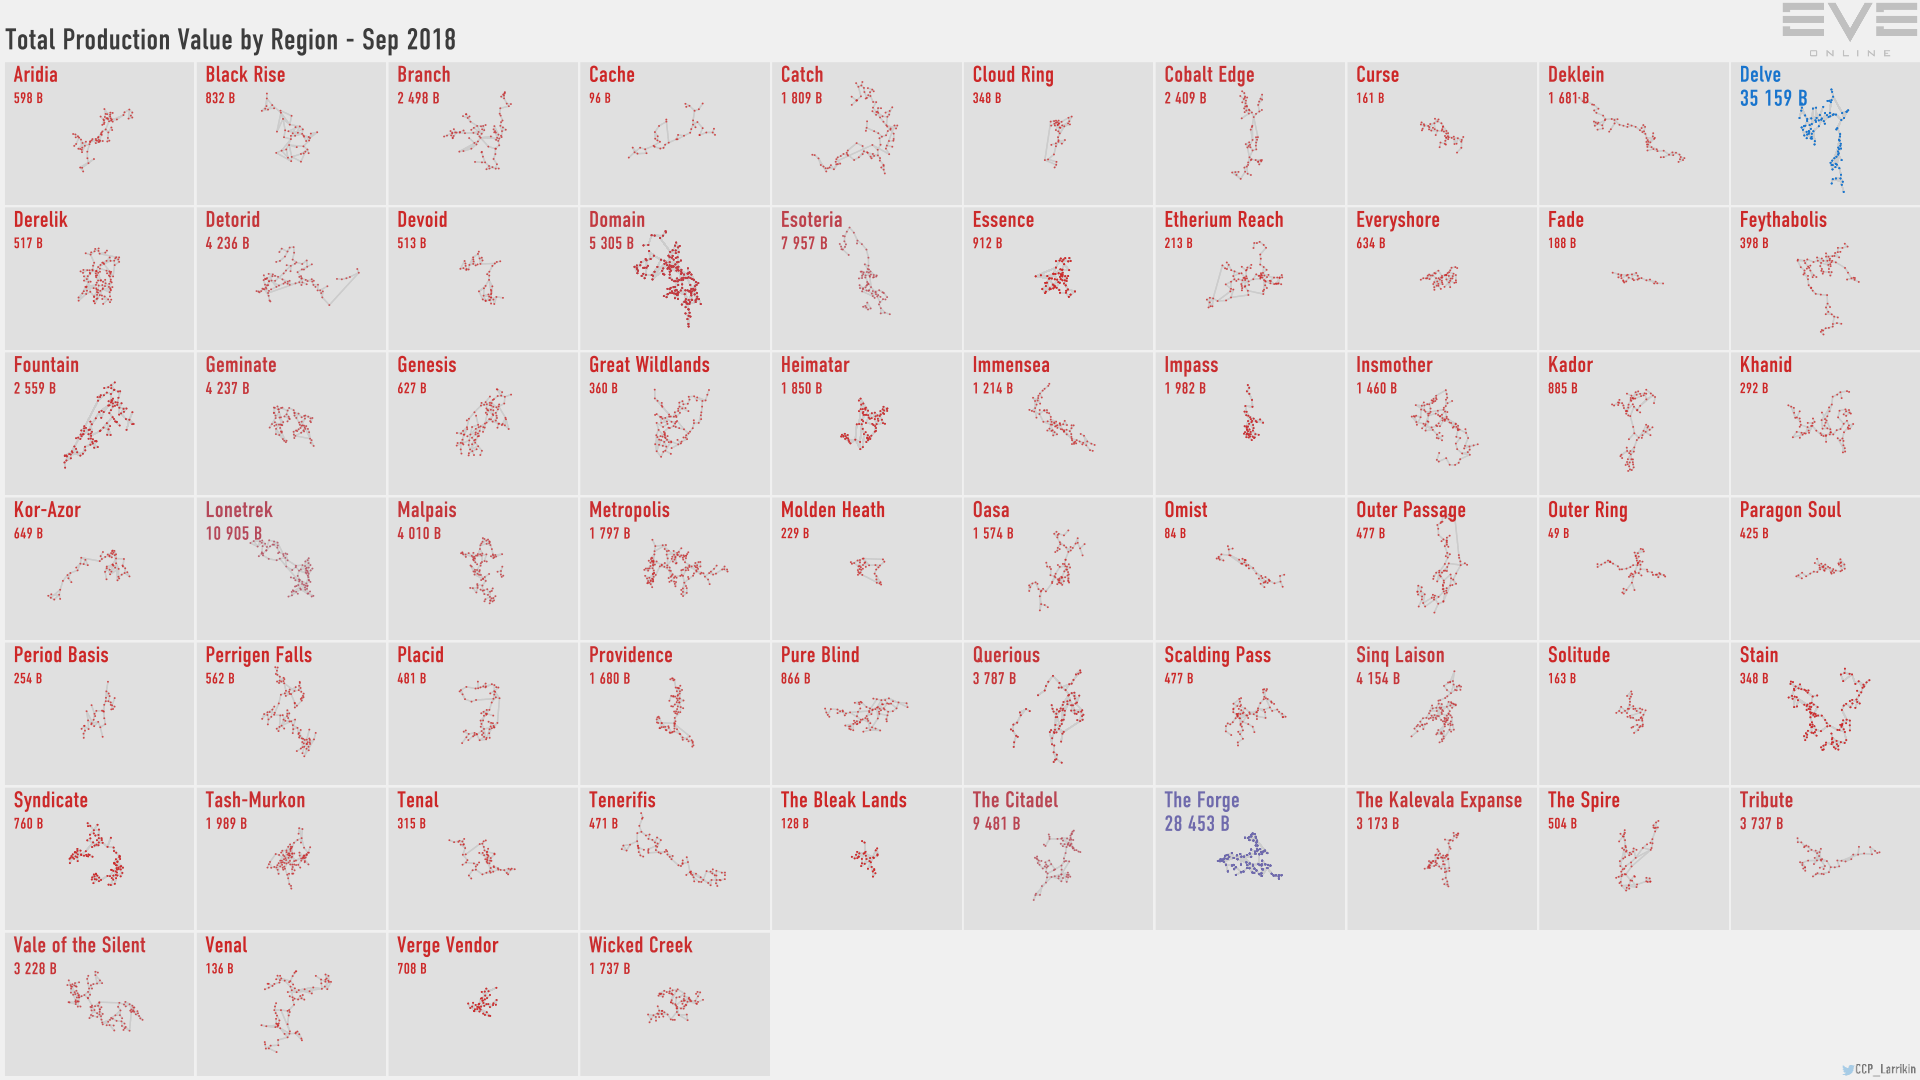
September 2018 – Production Values by Region
While production for the main market in The Forge was down almost 2.5 trillion ISK in value, in Delve it was up by over 5 trillion ISK in value, pushing it past The Forge for total production. The Mittani wants us all to own two titans now, so that has to be adding to the mix. (I still own zero titans, a number unlikely to increase ever.)
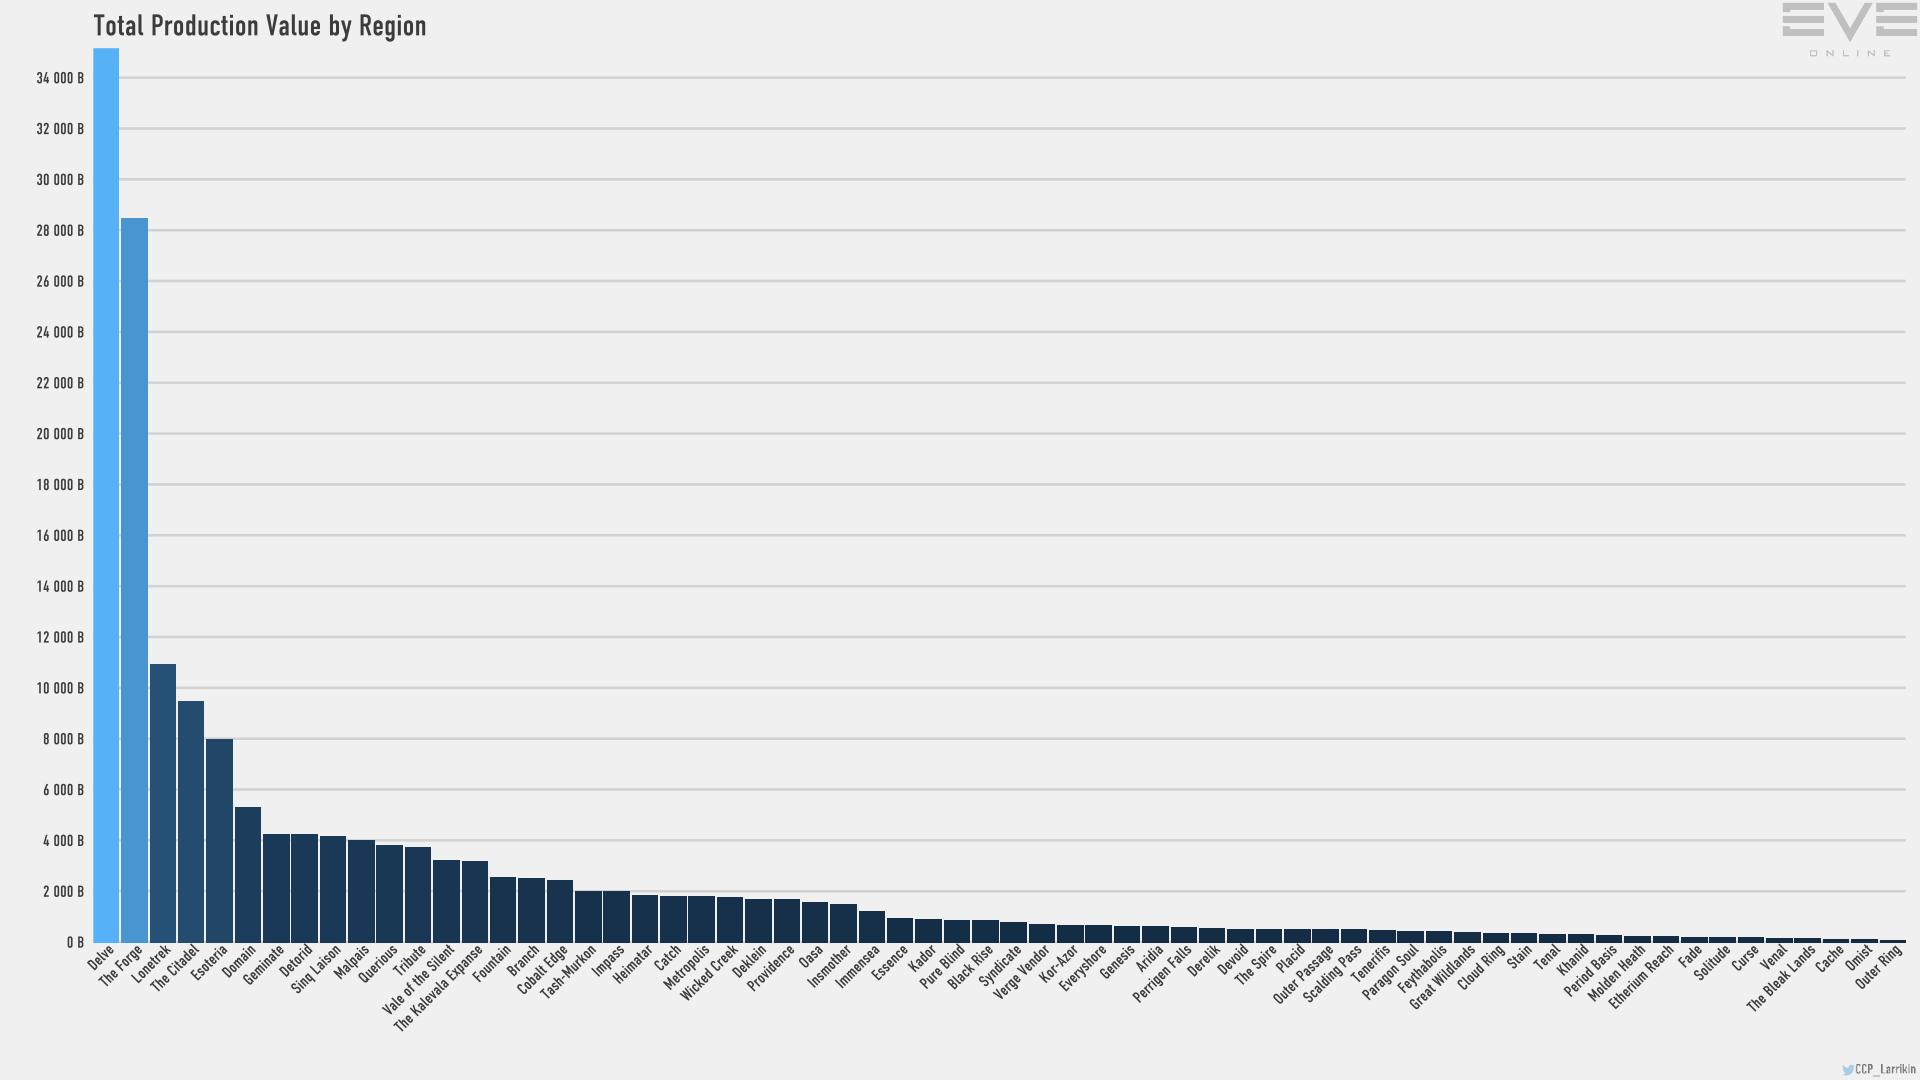
September 2018 – Production Values by Region – Bar Graph
Still, what I would call the “Jita production cluster,” which includes The Forge, The Citadel, and Lonetrek, still add up to more than Delve.
And, as I usually do, I will wrap up with the regions overview chart.

September 2018 – Regional Stats
So that is September. There was still a war going on, and Keepstars being destroyed, so it doesn’t show what peace really does to the economy, but it does show the start of the transition. Once CCP fixes the October reports I’ll look into that… though, honestly, I suspect they won’t bother. We’ll see if I’m in the mood to do another of these this month.
Anyway, you can find the whole September MER here, with more charts and all the data used to create it. (And the October is here if you want a peek. It might be fixed by the time this goes live.)
No comments:
Post a Comment