CCP got out the Monthly Economic Report for June 2019 last week, apologizing for its lateness, though it has come out later in some recent months. But as long as we get it I’m happy enough.
Every month I try to have a theme when I look at the MER, this month the theme is “What happens when the Imperium schleps up north for a war?” With that we can look at what happens in Delve while they are gone and what happens in the regions where they show up.
We will start with mining, one area that Delve has consistently dominated since Goons tamed the region in the back half of 2016. But last month? Not so much.

June 2019 – Mining Value by Region – Bar Graph
The stack rank takes Delve out of the top… I was going to guess top five, but it almost fell out of the top FORTY regions when it came to mining.
The top ten regions for mining value in ISK were:
- Esoteria – 3.31 trillion
- Detorid – 1.84 trillion
- Insmother – 1.78 trillion
- Domain – 1.31 trillion
- Branch – 1.25 trillion
- Querious – 1,19 trillion
- The Forge – 1.16 trillion
- Fountain – 1.12 trillion
- Sinq Laison – 843 billion
- Metropolis – 829 billion
And, way down the list, in 40th place, between Oasa and TKE is Delve.
- Delve – 276 billion
That is down, way down, from the 4.9 trillion mined in the region during May, which itself was way down from the 9.8 trillion mined in the region during April, which in turn was down from the more than 13 trillion ISK in minerals mined in the region in the month of March.
So, without a doubt, the Imperium deployment put the reigns on mining in the region as those who ignored the fact that the supercap umbrella was gone paid the price in Rorqual losses.
Overall mining numbers looked like this per region.

June 2019 – Mining Value by Region
Mining was down in other places, so we should probably look at the mineral price index to see if some of the decrease in value was related to a drop in market prices.

June 2019 – Economic Indices
As it turns out, the mineral price index was up so, if anything, the ore mined was worth more, so less was needed relative to May. Mineral prices still remain well below previous highs, but appear to be climbing slowly.
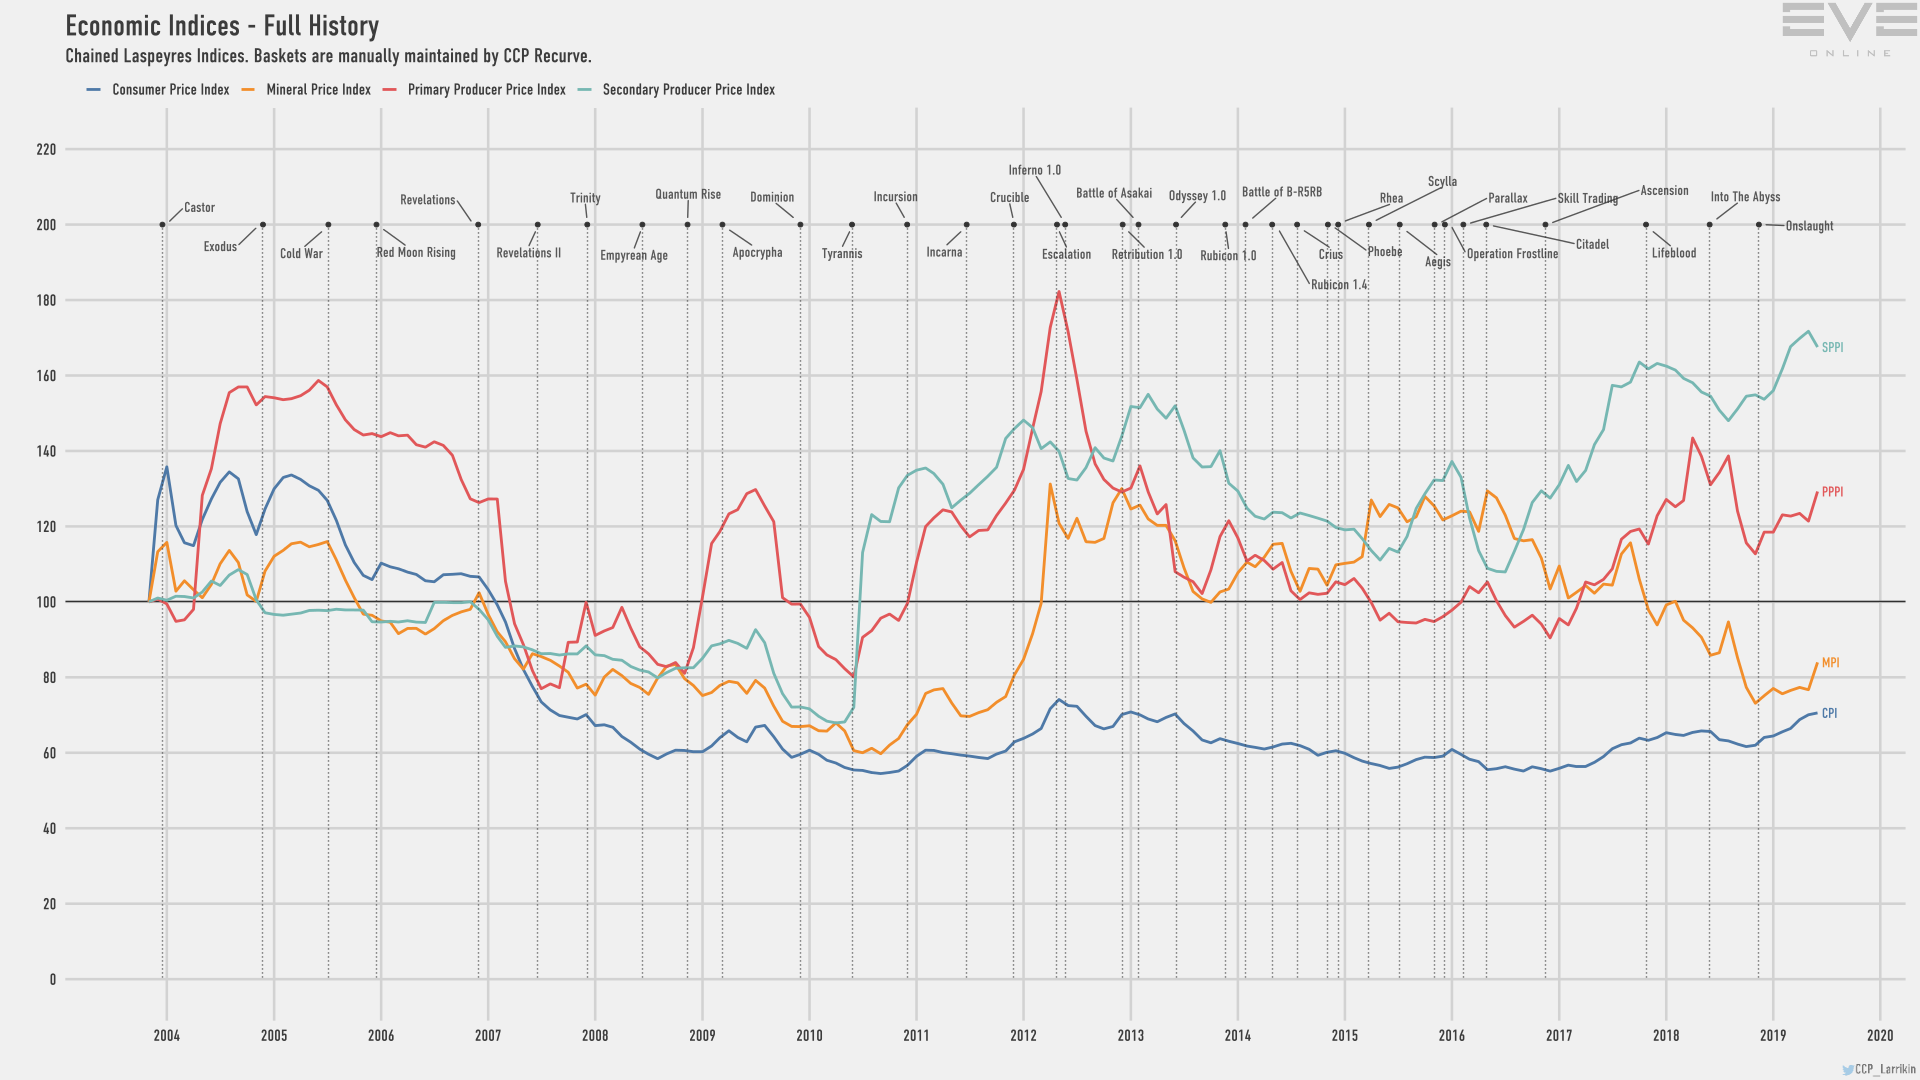
June 2019 – Economic Indices Long Term
Turning to NPC bounties, Delve fell out of first place last month, with Branch grabbing 5.6 trillion ISK in bounties to Delve’s 5.1 trillion ISK. That changed further with June’s totals.

June 2019 – NPC Bounties by Region – Bar Graph
Delve did not fall as hard as it did on the mining front, but it still fell out of the top ten, landing in the eleventh position overall for NPC bounties, behind even the Imperium rental region of Period Basis.
- Branch – 4.90 trillion
- Esoteria – 3.56 trillion
- Detorid – 2.88 trillion
- Insmother – 2.71 trillion
- Deklein – 2.70 trillion
- Cobalt Edge – 2.15 trillion
- Fountain – 1.96 trillion
- Tenal – 1.80 trillion
- Perrigen Falls – 1.70 trillion
- Period Basis – 1.67 trillion
- Delve – 1.57 trillion
Overall NPC bounties actually picked up as the month headed towards a close, though overall NPC bounties remain down from recent peaks.

June 2019 – Top Sinks and Faucets over time
The bump at the end corresponds somewhat with the commencement of the Drifter attacks on null sec, when everybody pulled back home. During that first week of attacks the Drifters ignored those ratting and mining in anomalies, concentrating Upwell Structures and those who came within range.
Overall NPC bounties totaled up approximately 48.2 trillion ISK in payouts, down from the 55.5 trillion ISK in payouts delivered in May, and well down from the pre-nerf total for March, where 71.4 trillion ISK was paid out for NPC kills.
That led to an actual reduction in the money supply in game over the course of the month.

June 2019 – Sinks and Faucets
Faucets were down by almost 15 trillion ISK, though sinks were also down, coming in 8 trillion ISK less than in May. However, the active ISK delta, which includes ISK seized by GMs for botting and RMT, was up 14 trillion ISK, leading in an overall reduction.
And, finally, since there was a war or two going on in null sec, we might as well look at the destruction numbers.

June 2019 – Destruction Value by Region
Stack ranking that by region ends up looking like this:

June 2019 – Destruction Value by Region – Bar Graph
The top ten regions saw the following destruction:
- The Forge – 3.46 trillion
- Detorid – 2.3 trillion
- Sinq Laison – 1.69 trillion
- Tribute – 1.58 trillion
- The Citadel – 1.53 trillion
- Black Rise – 1.37 trillion
- Delve – 1.28 trillion
- Placid – 1.11 trillion
- Lonetrek – 1.10 trillion
- Vale of the Silent – 1.10 trillion
The Forge, home of Jita, is also a nexus of high sec suicide ganking, and is always at or near the top of the list, was up from 3 trillion last month. Detroid, where TEST and Fraternity were clashing, made it into second place, up half a trillion from May.
The war zone for the Imperium, Tribute, only managed to make it into fourth, even with some Keepstar kills. There were no great battles of titans. Likewise, Vale of the Silent, which also saw structures and ihubs attack, only made it into tenth spot.
Delve, with no supercap umbrella, was in seventh, down from second in May, with a decrease of 700 billion in destruction.
Other regions, The Citadel, Lonetrek, Black Rise, Sinq Laison, and Placid, see action from their proximity to trade hubs. (Domain, which covers the remaining trade hub, was in 11th place.)
And so it goes. The war pulling so many people out of Delve had an impact. But with the coming of the Drifters we all came back home.
The theme for the July MER, when it comes out, will be what the Drifters, who did end up hitting ratters and miners this month, and the blackout, did to the numbers. I suspect that the day the blackout shows up and forward will be dramatic on that sinks and faucets chart. We shall see.
As always, all the charts and spreadsheets that make up the MER are available from CCP if you want to wallow in the data.
No comments:
Post a Comment