EVE Fanfest kicked off in Iceland yesterday and included the EVE Online keynote.

Fanfest 2017
Some of the keynote was spent reviewing what happened over the last year… or year and a bit in one case… with some statistics. And I love statistics so, since I happened to be home and able to watch the keynote, I grabbed screen shots of some of the slides with numbers to share and have to hand to compare against any future updates.
Citadels

Citadel stats as of Fanfest 2017
Citadel stats are something where I have a previous count from EVE Vegas 2016, which happened at the end of October last year, so we can see how that has progressed:
Deployed:
- Astrahus 14,322, up 7,632 since Vegas
- Fortizar 1,772, up 1,025 since Vegas
- Keepstar 38 , up 24 since Vegas
So the count for all citadel types have doubled since the end of October 2016.
Destroyed:
- Astrahus 2,353
- Fortizar 270
- Keepstar 4
Engineering Complexes
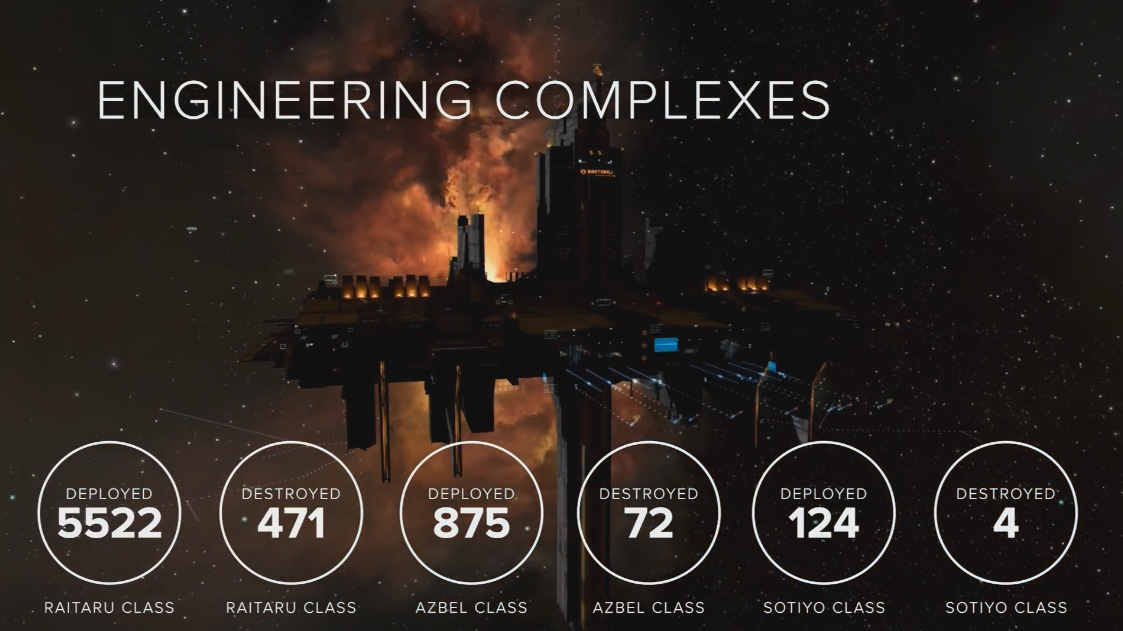
Engineering Complex stats as of Fanfest 2017
Engineering complexes came in with the Ascension expansion on November 15 of last year, taking over production abilities from the old school Player Owned Starbase, or POS. In the less than five months since then they have sprung up all over.
Deployed:
- Raitaru 5,522
- Azbel 875
- Sotiyo 123
Destroyed:
- Raitaru 471
- Azbel 72
- Sotiyo 4
Alpha Clones
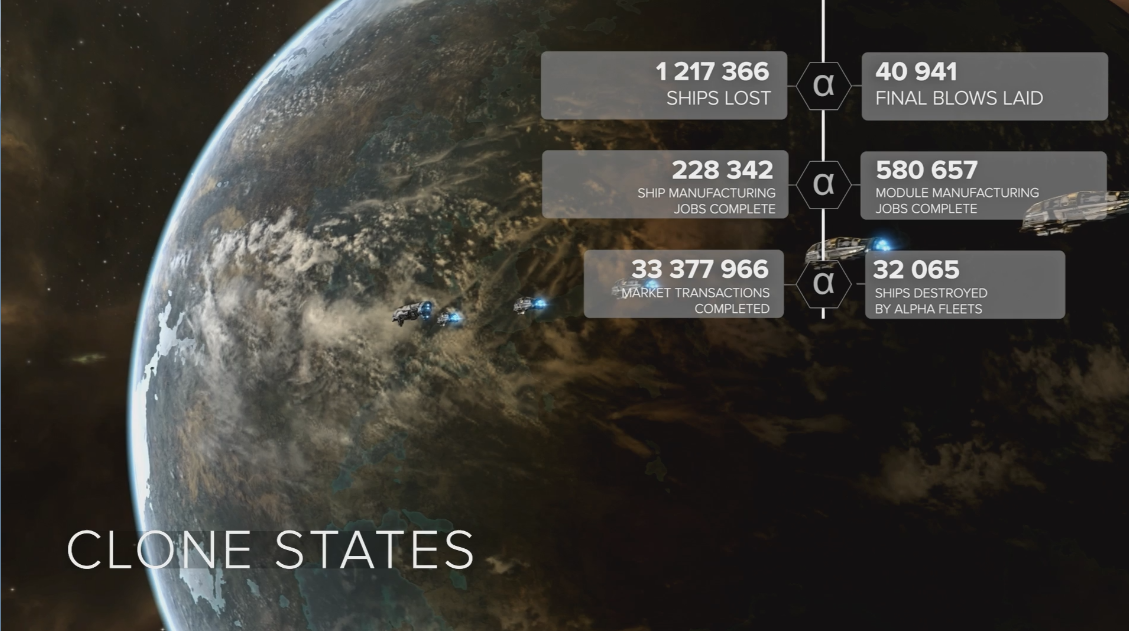
Alpha clone stats as of Fanfest 2017
Alpha clones, the limited “free” option for EVE Online, was the big feature that came in with the Ascension expansion last November, and they have popped up all over.
Alpha Clone Stats:
- Ships Lost 1,217,366
- Final Blows Landed 40,941
- Ships Destroyed by Alpha Fleets 32,065
- Ship Manufacturing Jobs 228,342
- Module Manufacturing Jobs 580,657
- Market Transactions 33,377,966
Those numbers would be more interesting if we knew what percentage of the total of New Eden they represented. But Alpha clones are out there.
Fighters

Fighter stats as of Fanfest 2017
The coming of the Citadel expansion in late April of 2016 not only brought new structures to New Eden, but also force auxiliary capital ships and changes to carriers and super carriers. Rather than drones and old-style fighters, they would use a new type of fighter.
Produced:
- Heavy 5,686,882
- Light 4,104,542
- Support 355,939
Destroyed:
- Heavy 10,419
- Light 205,112
- Support 11,286
Of course, I wonder how many fighters have been lost ratting as opposed to PvP.
Skill Trading

Skill trading stats as of Fanfest 2017
Skill trading, skill injectors, and skill extractors came along in February of last year as part of what I called the Mardi Gras release, since it fell on fat Tuesday.
- Skill Extractors Used 2,227,528
- Skill Injectors Used 2,198,120
- Skill Points Extracted 1,113,764,000,000
- Skill Points Injected 832,396,750,000
- Most Extracted Skill – Mining Barge
- Most Injected Skill – Drone Interfacing
So there are/were 29,408 skill injectors on the loose or on the market representing 14,704,000,000 extracted skill points. Of course, the one stat I really want is how many skill points disappeared because somebody took a 500K SP injector and only got a 150K SP boost.
Battles
CCP also highlighted three large battles that took place over the last year. Last Fanfest took place during the Casino War, but any large scale battles from that had already occurred and we were in the midst of the three months of skirmishes before the Imperium moved south to Delve. However, all three of those battles can be seen as fallout from the Casino War and all involved Circle of Two and citadels.

Conflict with Neighbors
The Battle at Oijanen in November of last year was over a Project Mayhem Astrahus and saw the Drone Region Federation lined up against alliances from the north including CO2 and TEST.

Death of a Keepstar
The final battle around the CO2 Keepstar in M-OEE8 in December was the culmination of the invasion of Tribute by Northern Coalition and Pandemic Legion. Once the Keepstar was destroyed, CO2 and their ally TEST evacuated the north to look for greener pastures. I was there for this battle.

Two Fortizars coming online
The battle at F4R2-Q in January was the other side of the coin from the battle at M-OEE8, as it represented CO2 and TEST attempting to grab new territory in null sec from the Stainwagon coalition. The battle itself was sparked by two Fortizars coming online, one for CO2 and one for TEST, that would give them a foothold in the Catch region. While they lost both Fortizars, Stainwagon resistance crumbled and the alliances have taken over much of their old space.
I was also there for this battle which will be remembered as the one where we managed to get Asher to give us 10 participation links, something he has vowed never to do again.
Anyway, those were the review slides that held statistical or historical interest for me.


